Download
1 / 47
570 likes | 1.87k Views
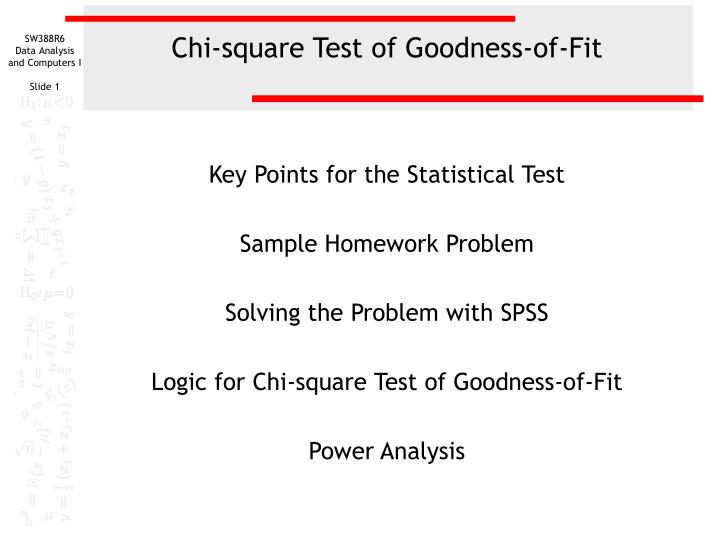
Chi-square Test of Goodness-of-Fit. Key Points for the Statistical Test Sample Homework Problem Solving the Problem with SPSS Logic for Chi-square Test of Goodness-of-Fit Power Analysis . Chi-square Test of Goodness-of-Fit : Purpose.

E N D
Chi-square Test of Goodness-of-Fit Key Points for the Statistical Test Sample Homework Problem Solving the Problem with SPSS Logic for Chi-square Test of Goodness-of-Fit Power Analysis
Chi-square Test of Goodness-of-Fit : Purpose • Purpose: test whether or not the proportion of subjects in each category matches our expectations • Examples: • The ethnic breakdown of the university differs from the statewide proportions • The ethnic breakdown of the school of social work differs from the university
Chi-square Test of Goodness-of-Fit: Hypotheses • Hypotheses: • Null: Observed frequencies = expected frequencies Versus • Research: Observed frequencies ≠ expected frequencies • Decision: • Reject null hypothesis if pSPSS ≤ alpha
Chi-square Test of Goodness-of-Fit: Assumptions and Requirements • Variable contains categories or groupings • Sample size is sufficiently large so that: • No cell has an expected frequency less than 1 or • No more than 20% of the cells contain an expected frequencies less than 5
Chi-square Test of Goodness-of-Fit: Effect Size • Cohen’s w measures difference in expected and observed proportions over all categories of the variable • Interpretation: • small: w = .10 to .30 • medium: w = .30 to .50 • large: w = .50 and higher
Chi-square Test of Goodness-of-Fit: APA Style • A chi-square test of goodness-of-fit is presented as follows: • Χ²(4, N= 57) = 3.17, p = .53 Degrees of freedom Number of cases Value of statistic Significance of statistic
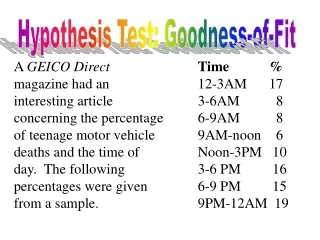
Homework problems: Chi-square test of goodness-of-fit This problem analyzes the variable "marital status" [marital] for a subset of the cases in GSS2000R.Sav. The subset is based on the variable "attitude toward life" [life]. Using an alpha of .05, is the following statement true, true with caution, false, or an incorrect application of a statistic? Previous research on survey respondents who said that they generally find life pretty routine found that the breakdown for "marital status" was 38.7% in the category 'married', 16.1% in the category 'widowed', 10.8% in the category 'divorced', 5.4% in the category 'separated' and 29.0% in the category 'never married'. A chi-square test of goodness-of-fit was performed on the variable "marital status" and found that the breakdown in our sample was significantly different from the breakdown found in previous research. HINT: Applying the percentage breakdown from previous research to our sample of 93 cases would result in expected frequencies of 36 in the category 'married', 15 in the category 'widowed', 10 in the category 'divorced', 5 in the category 'separated' and 27 in the category 'never married'. • True • True with caution • False • Incorrect application of a statistic This is the general framework for the problems in the homework assignment on the chi-square goodness-of-fit. The description is similar to findings one might state in a research article.
Homework problems: Data set, variables, and sample This problem analyzes the variable "marital status" [marital] for a subset of the cases in GSS2000R.Sav. The subset is based on the variable "attitude toward life" [life]. Using an alpha of .05, is the following statement true, true with caution, false, or an incorrect application of a statistic? Previous research on survey respondents who said that they generally find life pretty routine found that the breakdown for "marital status" was 38.7% in the category 'married', 16.1% in the category 'widowed', 10.8% in the category 'divorced', 5.4% in the category 'separated' and 29.0% in the category 'never married'. A chi-square test of goodness-of-fit was performed on the variable "marital status“ and found that the breakdown in our sample was significantly different from the breakdown found in previous research. HINT: Applying the percentage breakdown from previous research to our sample of 93 cases would result in expected frequencies of 5 in the category 'separated', 15 in the category 'widowed', 10 in the category 'divorced', 27 in the category 'never married' and 36 in the category 'married'. • True • True with caution • False • Incorrect application of a statistic • The first two paragraphs identify: • The data set to use, e.g. GSS2000R.Sav • The subset of cases to include in the analysis • The variable to use to create the subset • The variable used in the chi-square test of goodness-of-fit • Thealpha level to use in the hypothesis test
Homework problems: Specifications for the test • The second paragraph identifies: • The breakdown of the categories found in previous research/ This problem analyzes the variable "marital status" [marital] for a subset of the cases in GSS2000R.Sav. The subset is based on the variable "attitude toward life" [life]. Using an alpha of .05, is the following statement true, true with caution, false, or an incorrect application of a statistic? Previous research on survey respondents who said that they generally find life pretty routine found that the breakdown for "marital status" was 38.7% in the category 'married', 16.1% in the category 'widowed', 10.8% in the category 'divorced', 5.4% in the category 'separated' and 29.0% in the category 'never married'. A chi-square test of goodness-of-fit was performed on the variable "marital status"and found that the breakdown in our sample was significantly different from the breakdown found in previous research. HINT: Applying the percentage breakdown from previous research to our sample of 93 cases would result in expected frequencies of 36 in the category 'married', 15 in the category 'widowed', 10 in the category 'divorced', 5 in the category 'separated' and 27 in the category 'never married'. • True • True with caution • False • Incorrect application of a statistic • The fourth paragraph provides: • a hint that computes the expected frequencies that SPSS will need to compute the goodness-of-fit test. Expected frequencies are computed by multiplying the percentage found in each category as reported in the previous research(38.7%, 16.1%, etc.) times the total number of cases in our sample (93).
Homework problems: Choosing an answer The answer to a problem will be True if the goodness-of-fit test supports the finding in the problem statement. Since it is legitimate to use ordinal variables in the chi-square goodness-of-fit test, True with caution is not used for these problems. This problem analyzes the variable "marital status" [marital] for a subset of the cases in GSS2000R.Sav. The subset is based on the variable "attitude toward life" [life]. Using an alpha of .05, is the following statement true, true with caution, false, or an incorrect application of a statistic? Previous research on survey respondents who said that they generally find life pretty routine found that the breakdown for "marital status" was 38.7% in the category 'married', 16.1% in the category 'widowed', 10.8% in the category 'divorced', 5.4% in the category 'separated' and 29.0% in the category 'never married'. A chi-square test of goodness-of-fit was performed on the variable "marital status" and found that the breakdown in our sample was significantly different from the breakdown found in previous research. HINT: Applying the percentage breakdown from previous research to our sample of 93 cases would result in expected frequencies of 36 in the category 'married', 15 in the category 'widowed', 10 in the category 'divorced', 5 in the category 'separated' and 27 in the category 'never married'. • True • True with caution • False • Incorrect application of a statistic The answer to a problem will be False if the goodness-of-fit test does not support the finding in the problem statement. The answer to a problem will Incorrect application of a statistic if the goodness-of-fit test violates the sample size requirement, i.e. no expected frequencies less than 1 and no more than 20% of the expected frequencies less than 5.
Solving the problem with SPSS: Selecting the subset - 1 Our next task in SPSS is to select the subset cases that will be used in the analysis. The problem statement tell us “The subset is based on the variable "attitude toward life" [life], and that we are specifically interested in “survey respondents who said that they generally find life pretty routine. Our first task is to find the data value for life which represents survey respondents who said life was pretty routine. We go to the Variable View in the SPSS Data Editor and locate the variable.
Solving the problem with SPSS: Selecting the subset - 2 We scroll to the right until we see the Values column. When we click on the cell for sex in the values column, a button with an ellipsis on it appears. Click on this button to open the Values Label dialog box. Click on OK to close the dialog box. The Values Labels dialog box shows us the text labels that the creator of the data set assigned to each of the possible numeric responses for this variable. 2 = “ROUTINE” would be the obvious choice to indicate respondents who said that they generally find life pretty routine. This analysis will include cases who have a score of 2 for the variable life.
Solving the problem with SPSS: Selecting the subset - 3 To select the subset of cases for this analysis, we return to the Data View of the SPSS Data Editor and we choose the Select Cases… command from the Data menu.
Solving the problem with SPSS: Selecting the subset - 4 In the Select Cases dialog box, we mark the option button If condition is satisfied, and click on the If… button which becomes active when the option button is marked.
Solving the problem with SPSS: Selecting the subset - 5 Second, we click on the right arrow button to move the variable to the text box where we will compose our selection criteria. First, we highlight the variable we want to use, life, in selecting the subset.
Solving the problem with SPSS: Selecting the subset - 6 First, we complete the selection criteria by typing the value for the cases we want to include, = 2. Second, we click on the Continue button to close the Select Cases: If dialog box.
Solving the problem with SPSS: Selecting the subset - 7 When we return to the Select Cases dialog, we see that SPSS has printed our selection criteria next to the If… button. Click on the OK button to complete the selection of the subset.
Solving the problem with SPSS: Selecting the subset - 8 When we return to the Data Editor, we scroll the variables to the right until we see the column for life. We see that SPSS has marked out the cases that will be excluded by drawing a diagonal slash through the row number. The cases that are excluded have a “1” for “DULL,” a “3” for EXCITING, or are missing answers. The cases with a value of “2” for life do not have the slash and will be included in the analysis.
Solving the problem with SPSS:Level of measurement The chi-square test of goodness-of-fit can be used with variables at any level of measurement, provided there are a discrete number of categories. Continuous variables should be grouped in classes. Marital status [marital] is a nominal variable with 5 categories (9 = “NA” if a missing data value).
Solving the problem with SPSS: The chi-square test of goodness-of-fit - 1 To get the information to answer the question of sample size, we must run the test. Select Nonparametric Tests > Chi-Square… from the Analyze menu.
Solving the problem with SPSS: The chi-square test of goodness-of-fit - 2 The finding we are trying to verify is: A chi-square test of goodness-of-fit was performed on the variable "marital status" and found that the breakdown in our sample was significantly different from the breakdown found in previous research. First, move the variable marital to the Test Variables List list box. Third, type in the first expected frequency from the problem Hint. HINT: Applying the percentage breakdown from previous research to our sample of 93 cases would result in expected frequencies of 36 in the category 'married', 15 in the category 'widowed', 10 in the category 'divorced', 5 in the category 'separated' and 27 in the category 'never married'. Second, click on the Values option button to let SPSS know we will enter the expected frequencies ourselves. Fourth, click on the Add button to move the value 36 to the list.
Solving the problem with SPSS: The chi-square test of goodness-of-fit - 3 When we clicked on the Add button, the value 36 is added to the end of the list. First, type in the second expected frequency from the problem Hint. HINT: Applying the percentage breakdown from previous research to our sample of 93 cases would result in expected frequencies of 36 in the category 'married', 15 in the category 'widowed', 10 in the category 'divorced', 5 in the category 'separated' and 27 in the category 'never married'. Second, click on the Add button to move the value 15 to the list.
Solving the problem with SPSS: The chi-square test of goodness-of-fit - 3 HINT: Applying the percentage breakdown from previous research to our sample of 93 cases would result in expected frequencies of 36 in the category 'married', 15 in the category 'widowed', 10 in the category 'divorced', 5 in the category 'separated' and 27 in the category 'never married'. When we have typed in all of the expected frequencies, we click on the OK button to generate the output. When we clicked on the Add button, the value 15 is added to the end of the list. Add the remaining expected frequencies 10, 5, and 27 to the list.
Solving the problem with SPSS: Checking expected frequencies The finding we are trying to verify is: A chi-square test of goodness-of-fit was performed on the variable "computer use" and found that the breakdown in our sample was significantly different from the breakdown found in previous research. Our first task is to make certain we have entered the expected frequencies correctly. We double check the expected frequencies in the table against the hint. HINT: Applying the percentage breakdown from previous research to our sample of 93 cases would result in expected frequencies of 36 in the category 'married', 15 in the category 'widowed', 10 in the category 'divorced', 5 in the category 'separated' and 27 in the category 'never married'. The categories and expected frequencies match up correctly.
Solving the problem with SPSS: Sample size requirements Our second task is to verify the sample size requirements. The information we need to verify that we meet the sample size requirements is in the footnote to the Test Statistics table. The minimum expected frequency in any cell was 5, which is larger than the minimum requirement of 1. None of the cells had an expected frequency less than 5. The sample size requirements for the chi-square test are satisfied.
Solving the problem with SPSS: Answering the question - 1 The finding we are trying to verify is: A chi-square test of goodness-of-fit was performed on the variable "marital status" and found that the breakdown in our sample was significantly different from the breakdown found in previous research. Having satisfied the sample size requirement, we look to the table of Test Statistics for the hypothesis test. The chi-square test of goodness-of-fit for this problem produced the statistical result: Chi-square (4, N = 93) = 10.02, p = .04.
Solving the problem with SPSS: Answering the question - 2 Since the probability for the chi-square statistic is less than or equal to the alpha level of 0.05 we reject the null hypothesis and support the research hypothesis. The breakdown for our sample is different from that found in previous research. Our sample is either unlikely to be from the same population reported in previous research, or some event has altered the breakdown of the cases.
Restoring all of the cases to the dataset - 1 We have selected a specific subset of cases for this problem. To make sure we do not use the wrong subset for the next problem, we will restore all of the cases to the data set. Click on the Select Cases… command from the Data menu.
Restoring all of the cases to the dataset - 2 Click on the All cases option button to remove the If condition. Click on the OK button to complete the command.
Restoring all of the cases to the dataset - 3 The slashes through the case numbers are removed, indicating that all of the cases are available to the next command.
Logic for homework problems: Chi-square Test of Goodness-of-Fit 1 Select subset of cases specified in problem Compute chi-square test of goodness-of-fit No expected frequencies < 1? No Inappropriate application of a statistic Yes
Logic for homework problems: Chi-square Test of Goodness-of-Fit 2 No more than 20% of expected frequencies < 5? No Inappropriate application of a statistic Yes Probability of the test statistic less than alpha? No False Yes True
Power Analysis: Chi-square Goodness-of-fit Problem that was False This problem analyzes the variable "marital status" [marital] for a subset of the cases in GSS2000R.Sav. The subset is based on the variable "seen x-rated movie in last year" [xmovie]. Using an alpha of .01, is the following statement true, true with caution, false, or an incorrect application of a statistic? Previous research on survey respondents who had not seen an x-rated movie in the last year found that the breakdown for "marital status" was 52.2% in the category 'married', 7.4% in the category 'widowed', 11.8% in the category 'divorced', 2.9% in the category 'separated' and 25.7% in the category 'never married'. A chi-square test of goodness-of-fit was performed on the variable "marital status" and found that the breakdown in our sample was significantly different from the breakdown found in previous research. HINT: Applying the percentage breakdown from previous research to our sample of 136 cases would result in expected frequencies of 71 in the category 'married', 10 in the category 'widowed', 16 in the category 'divorced', 4 in the category 'separated' and 35 in the category 'never married'. 1 True 2 True with caution 3 False 4 Incorrect application of a statistic The answer to this problem was false because the probability for the chi-square test was 0.15, greater than the alpha of 0.01. We can conduct a post-hoc power analysis to determine if the number of available cases was sufficient to find a statistically significant difference.
Power Analysis: Results for Chi-square Goodness of Fit - 1 The answer to the problem was false because the significance of the chi-square statistic (Asymp. Sig.) = .153, less than the alpha of .01.
Power Analysis: Results for Chi-square Goodness of Fit - 2 To conduct the power analysis, we will need to compute the effect size statistic, w, which compares the expected proportions stated in the problem to the actual proportions in the SPSS output. The proportion in each cell is found in the Valid Percent column.
Access to G*Power Program SamplePower, the SPSS program for power analysis, does not include the chi-square goodness-of-fit test. However, another free software program, G*Power, does the calculations for us. Navigate to the page shown in the web address box, scroll down the page, download and install the program.
Power Analysis for Chi-square Goodness-of-fit Test - 1 Click on the OK button on the title screen. This is an old DOS program that will run in Windows.
Power Analysis for Chi-square Goodness-of-fit Test - 2 Click on the OK button on the Information screen.
Power Analysis for Chi-square Goodness-of-fit Test - 3 Click on the Tests menu to open it. Scroll down the list and click on the Chi²-Test command.
Power Analysis for Chi-square Goodness-of-fit Test – 3a Since we have already computed the statistic, we mark the Post hoc option to compute the power that we had for the test.
Power Analysis for Chi-square Goodness-of-fit Test - 4 In order to calculate the power for the test, we must first compute the effect size, w, for our problem. Click on the Calc Effectsize button.
Power Analysis for Chi-square Goodness-of-fit Test - 5 In our problem, the variable had five categories, so we change the default 4 to a 5. The P(H0) column contains the frequencies expected under the null hypothesis, i.e., stated in the problem. The P(H1) column contains the percentages under the research hypothesis, i.e. tested for differences in SPSS.
Power Analysis for Chi-square Goodness-of-fit Test - 6 Second, correct the entries in the row by backspacing over the previous entry and typing the correct number. Pressing the enter key will generate an error message rather than moving the corrected data to the table. To edit another row, click on its row number. First, to change the values for each cell, we double click on the row number in the list to move the row data to the editing row. The P(H1) column contains the percentages under the research hypothesis, i.e. tested for differences in SPSS. The P(H0) column contains the frequencies expected under the null hypothesis, i.e., stated in the problem.
Power Analysis for Chi-square Goodness-of-fit Test - 7 To compute the effect size and move the value to the window where power is calculated, click on the Calc & Copy button. If the percentages in each column to not equal 1, GPOWER will not go back to the previous window. To correct the problem, change the entry in row 5 from 0.191 to 0.192.
Power Analysis for Chi-square Goodness-of-fit Test - 8 The effect size for our data is 0.22, a small effect. The scale is conveniently listed at the bottom of the window.
Power Analysis for Chi-square Goodness-of-fit Test - 9 First, change the Total sample size to the 136 cases we had for this analysis. Third, click on the Calculate button to obtain the answer. Second, change the degrees of freedom Df to the 4 which we found in our SPSS output.
Power Analysis for Chi-square Goodness-of-fit Test - 10 GPOWER computes that we had 0.52 as the measure of power for our analysis, i.e. about a 50-50 change of detecting the small effect associated with the data available for our analysis.