Download
1 / 39
390 likes | 392 Views
This study examines the number of new patients, transplants, permanent transfers, deaths, and dialysis stock and flow of CAPD patients in Australia and New Zealand from 1992 to 1999. It also includes data on age, BMI, peritonitis-free survival, technique survival, relationship between weight gain and survival, KT/V related to dialysate volume, residual GFR, racial and diabetic origins, and peritoneal transport status.

E N D
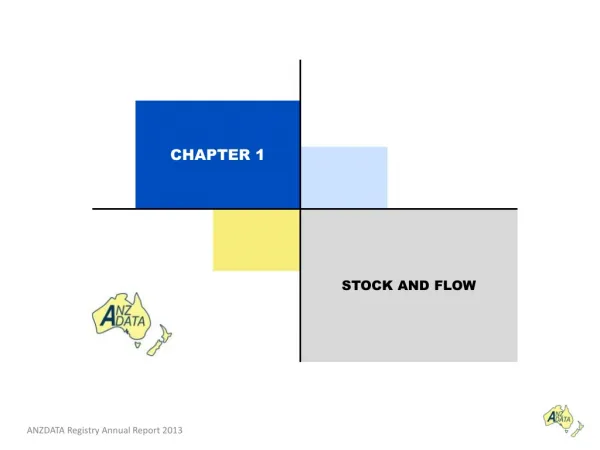
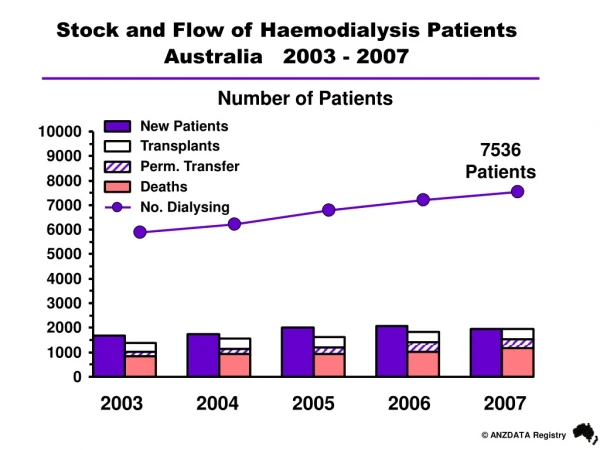
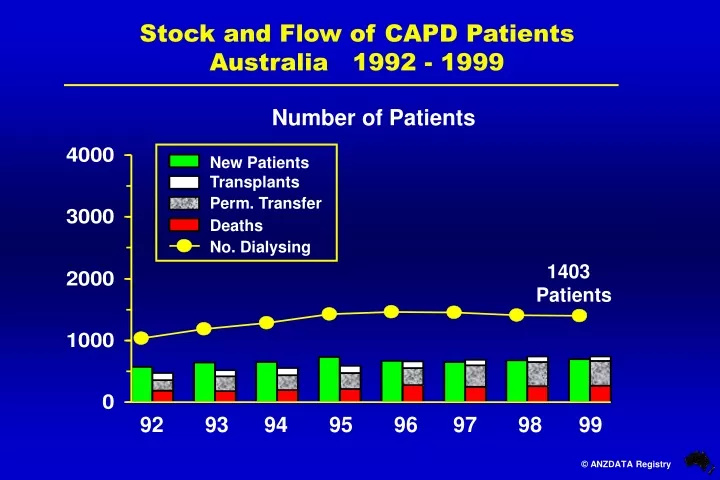
New Patients Transplants Perm. Transfer Deaths No. Dialysing Stock and Flow of CAPD PatientsAustralia 1992 - 1999 Number of Patients 1403 Patients 92 93 94 95 96 97 98 99
New Patients Transplants Perm. Transfer Deaths No. Dialysing Stock and Flow of CAPD PatientsNew Zealand 1992 - 1999 Number of Patients 621 Patients 92 93 94 95 96 97 98 99
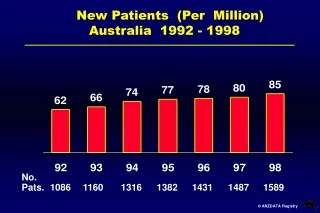
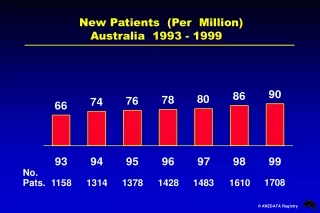
Number (Per Million) CAPD Patients Australia 1992 - 1999
Age of New CAPD Patients No. Pats. 5 16 35 69 114 132 228 96 1
Age of Dialysing CAPD Patients No. Pats. 4 20 77 119 236 301 436 205 5
Number (Per Million) CAPD Patients New Zealand 1992 - 1999
Age of New CAPD Patients No. Pats. 3 4 12 23 56 77 61 23 2
Age of Dialysing CAPD Patients No. Pats. 0 13 33 64 127 178 160 42 4
Australia 1996 - 2000 BMI <20
New Zealand 1996 - 2000 BMI <20
Australia 1996 - 2000 BMI 20 - 24.9
New Zealand 1996 - 2000 BMI 20 - 24.9
Australia 1996 - 2000 BMI 25 - 29.9
New Zealand 1996 - 2000 BMI 25 - 29.9
Australia 1996 - 2000 BMI 30 - 34.9
New Zealand 1996 - 2000 BMI 30 - 34.9
Peritonitis Free Survival Related to Race Australia 1992 - 1995 Caucasoid 35-54 yrs 55-64 yrs 35-54 yrs 55-64 yrs Aboriginal Maori/Pac Isl
Peritonitis Free Survival Related to Race Australia 1996 - 1999 Caucasoid 55-64 yrs 35-54 yrs 55-64 yrs 35-54 yrs Aboriginal Maori/Pac Isl
Peritonitis Free Survival Related to Race New Zealand 1992 - 1995 Caucasoid 55-64 yrs 35-54 yrs Maori/Pac Isl 35-54 yrs 55-64 yrs
Peritonitis Free Survival Related to Race New Zealand 1996 - 1999 Caucasoid 35-54 yrs 55-64 yrs Maori/Pac Isl 35-54 yrs 55-64 yrs
First CAPD Treatment to First Peritonitis Related to Age at Entry 1996 - 1999 % Survival Australia Age Group
First CAPD Treatment to First Peritonitis Related to Age at Entry 1996 - 1999 % Survival New Zealand Age Group
Patient Survival (PD Treatment at 90 days) Related to BMI 1991 - 1999 Australia BMI < < 20 vs 20-27.5 p=0.1505 < 20 vs >27.5 p=0.0294 20-27.5 vs >27.5 p=0.2183 Transplant Censored HD included
Technique Survival (PD Treatment at 90 days) Effect of Weight Gain in First 12 Monthson Subsequent Survival 1991 - 1999 Australia BMI Change < > < 2.5 vs > 2.5 p=<0.01 Transplant and Death Censored
Technique Survival (PD Treatment at 90 days) Effect of Weight Gain in First 12 Monthson Subsequent Survival 1991 - 1999 Australia BMI Change < > < 2.5 vs > 2.5 p=<0.01 Transplant Censored Death Failure
Technique Survival (PD Treatment at 90 days) Effect of Weight Gain in First 12 Monthson Subsequent Survival 1991 - 1999 Australia BMI Change < > < 2.5 vs >2.5 p=0.0562 Transplant Censored HD Included
KT/V Related to Volume of DialysateAustralia March 2000 Prescribed Achieved KT/V (Total) Dialysate Volume 1.8 > 1.8 56 L / week 96 (22.1%) 338 (77.9%) 70 L / week 145 (26.5%) 403 (73.5%) 241 741
KT/V Related to Volume of DialysateNew Zealand March 2000 Prescribed Achieved KT/V (Total) Dialysate Volume 1.8 > 1.8 56 L / week 41 (21.5%) 150 (78.5%) 70 L / week 70 (28.1%) 179 (71.9%) 111 329
Relationship of Residual GFR to KT/VMarch 2000 Residual GFR KT/V (Total) + S.E < 1 ml / min 1.99 ± 0.03 Aust 1 ml / min 2.31 ± 0.03 < 1 ml / min 1.97 ± 0.03 NZ 1 ml / min 2.35 ± 0.04
Technique Survival PD (Censor Death and Transplantation) Racial Origin 1990 - 1995 Australia Cauc vs Aboriginal p = 0.0019
Technique Survival PD (Censor Death and Transplantation) Racial Origin 1990 - 1995 New Zealand Cauc vs Pac Isl p = 0.0003 Maori vs Pac Isl p = 0.4020 Asian vs Pac Isl p = 0.1159
Technique Survival PD (Censor Death and Transplantation) Diabetic and Racial Origin 1990 - 1995 Australia
Technique Survival PD(Censor Death and Transplantation) Diabetic and Racial Origin 1990 - 1995 New Zealand
Technique Survival PD (Censor Death and Transplantation) Non Diabetic and Racial Origin 1990 - 1995 Australia
Technique Survival PD(Censor Death and Transplantation) Non Diabetic and Racial Origin 1990 - 1995 New Zealand
PET D/P Creatinine at Four HoursNew PD Patients from 1-Oct-98
Peritoneal Transport Status New Patients 1-Oct-1998 to 31-Mar-2000