Download
1 / 29
290 likes | 296 Views
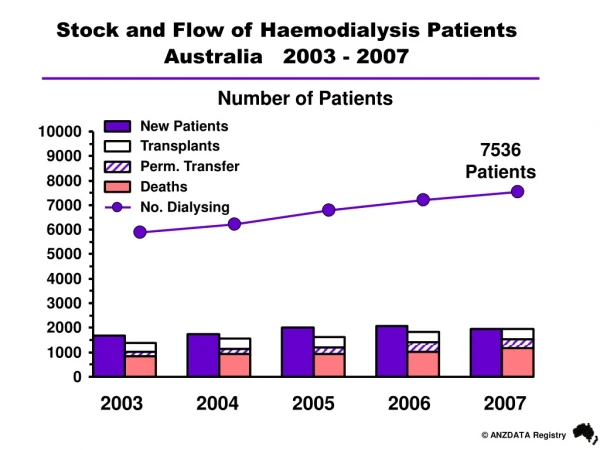
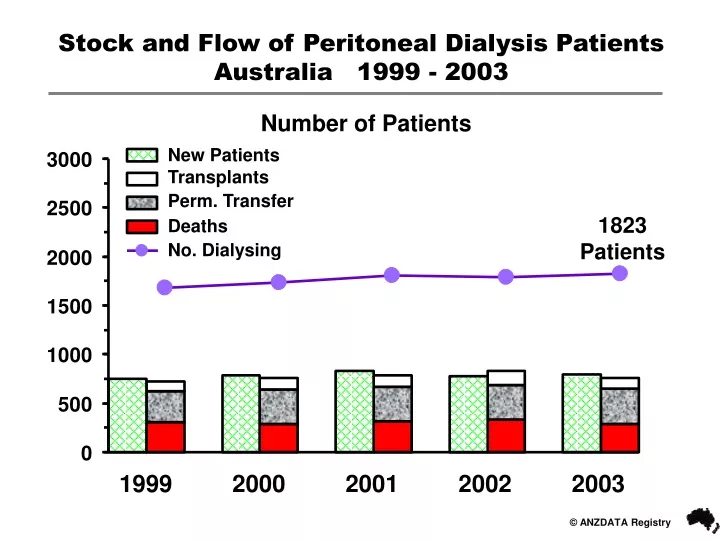
Stock and Flow of Peritoneal Dialysis Patients Australia 1999 - 2003. Number of Patients. New Patients Transplants Perm. Transfer Deaths No. Dialysing. 1823 Patients. 1999 2000 2001 2002 2003.

E N D
Stock and Flow of Peritoneal Dialysis PatientsAustralia 1999 - 2003 Number of Patients New Patients Transplants Perm. Transfer Deaths No. Dialysing 1823 Patients 1999 2000 2001 2002 2003
Stock and Flow of Peritoneal Dialysis PatientsNew Zealand 1999 - 2003 Number of Patients New Patients Transplants Perm. Transfer Deaths No. Dialysing 769 Patients 1999 2000 2001 2002 2003
Age of New PD Patients 2003 Australia No. Pats. 20 21 52 84 110 153 215 134 5
Age of Dialysing PD Patients 31-Dec-2003 Australia No. Pats. 25 36 93 185 264 366 525 315 14
PD Patients (%) of all Prevalent Dialysis Australia31-Dec-2003
Number (Per Million) Prevalent PD Patients Australia 1999 - 2003
Number of Prevalent APD/CAPD Patients Australia 1999 - 2003 % APD 4.4% 6.1% 7.3% 8.4% 9.5%
Number (Per Million) Prevalent APD Patients Australia 1999 - 2003
PD Patients (%) of all Prevalent Dialysis New Zealand 31-Dec-2003
Number (Per Million) Prevalent PD Patients New Zealand 1999 - 2003
Number of Prevalent APD/CAPD Patients New Zealand 1999 - 2003 % APD 4.2% 6.1% 7.6% 8.5% 8.9%
Number (Per Million) Prevalent APD Patients New Zealand 1999 - 2003
Age of New PD Patients 2003 New Zealand No. Pats. 7 11 10 26 45 68 67 23 3
Age of Dialysing PD Patients New Zealand 31-Dec-2003 No. Pats. 7 29 46 70 133 208 186 83 7
First PD Treatment to First Peritonitis Related to Age at Entry 1999 - 2003 % Survival Australia Age Group
First PD Treatment to First Peritonitis Related to Age at Entry 1999 - 2003 % Survival New Zealand Age Group
First PD Treatment to First Peritonitis Related to Race Australia 1994-1998 Caucasoid 35-54 yrs 55-64 yrs 35-54 yrs 55-64 yrs Aboriginal/Torres St Maori/Pac Isl
First PD Treatment to First Peritonitis Related to Race Australia 1999-2003 Caucasoid 35-54 yrs 55-64 yrs 55-64yrs 35-54 yrs Aboriginal/Torres St Maori/Pac Isl
First PD Treatment to First Peritonitis Related to Race New Zealand 1994-1998 Caucasoid 35-54 yrs 55-64 yrs Maori/Pac Isl 35-54 yrs 55-64 yrs
First PD Treatment to First Peritonitis Related to Race New Zealand 1999-2003 Caucasoid 35-54 yrs 55-64 yrs Maori/Pac Isl 55-64 yrs 35-54 yrs
Relationship of Residual GFR to Kt/VMarch 2004 Residual GFR Dialysate 95% C.I Kt/V <= 1 ml / min (n=341) 2.09 (1.21 – 2.97) Aust > 1 ml / min (n=918) 1.98 (0.73 – 3.23) <= 1 ml / min (n=158) 2.08 (1.2 – 2.96) NZ > 1 ml / min (n=395) 1.73 (0.65 – 2.81)
Kt/V Related to Volume of DialysateAustralia March 2004 Prescribed Achieved Kt/V (Total) Dialysate Volume <= 1.8 > 1.8 <= 56 L / week 220 (44%) 282 (56%) >= 70 L / week 241 (33%) 480 (67%) 461 762
Kt/V Related to Volume of DialysateNew Zealand March 2004 Prescribed Achieved Kt/V (Total) Dialysate Volume <= 1.8 > 1.8 <= 56 L / week 152 (68%) 72 (32%) >= 70 L / week 150 (40%) 228 (60%) 302 300
PET D/P Creatinine at Four HoursNew PD Patients from 1-Apr-99 to 31-Mar-04
Peritoneal Transport Status New PD Patients 1-Apr-1999 to 31-Mar-2004
Primary Organism for all Peritonitis Episodes Australia 1-Oct-2003 to 31-Mar-2004
Initial Antibiotic Regimens by State1-Oct-2003 to 31-Mar-2004 Percentage