Download
1 / 18
180 likes | 192 Views
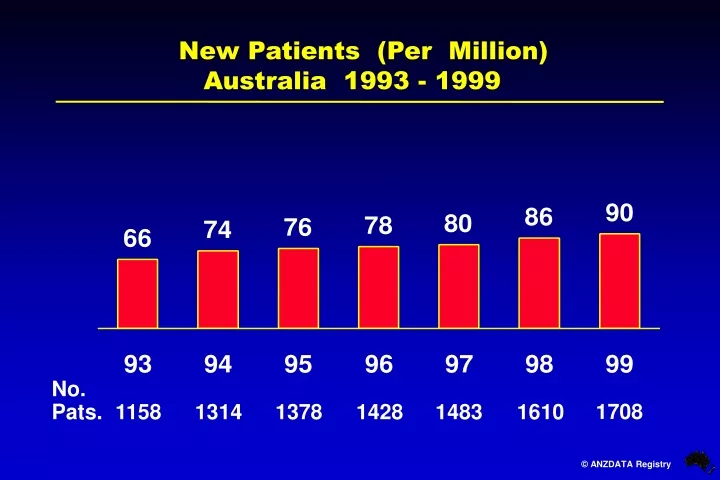
1708. 1158. 1314. 1378. 1428. 1483. 1610. New Patients (Per Million) Australia 1993 - 1999. No. Pats. No. Pats. 198. 304. 551. 442. 23. 140. 50. New Patients (Per Million) Australian States 1999. Age of New Patients - Australia 1999.

E N D
1708 1158 1314 1378 1428 1483 1610 New Patients (Per Million) Australia 1993 - 1999 No. Pats.
No. Pats. 198 304 551 442 23 140 50 New Patients (Per Million) Australian States 1999
Age of New Patients - Australia 1999 New Patients (1708) Median Age 61.1 yrs Per Million Age Group 6 5 20 38 64 115 191 388 272 37 0 0 16 25 31 30 27 16 0 Diabetic % 0 0 0 0 12 14 7 3 <1 0 0 Type 1
Acceptance of New Patients 1993 - 1999 Age Specific Rates - Australia Patients Per Million
New Patients (Per Million) New Zealand 1993 - 1999 No. Pats. 368 232 248 288 290 320 370
Age of New Patients - New Zealand 1999 New Patients (368) Median Age 57.2 yrs Per Million Age Group 3 7 19 44 62 172 294 308 226 44 0 10 12 32 58 51 39 15 0 0 Diabetic % 0 0 0 8 22 6 2 0 0 0 Type 1
Acceptance of New Patients 1993 - 1999 Age Specific Rates - New Zealand Patients Per Million
New Acceptances by RaceAustralia 1992 - 1999 Patients Per Million
New Acceptances by RaceNew Zealand 1992 - 1999 Patients Per Million
Female (n=1356) Female (n=269) Male (n=848) Male (n=426) New Patients Creatinine Clearance at EntryApril 1998 - March 2000 % Australia New Zealand All Pts % 18 61 16 3 1 14 59 22 4 1
25-54 yrs (n=268) 25-54 yrs (n=1143) 65-74 yrs (n=146) 65-74 yrs (n=928) New Patients Creatinine Clearance at EntryApril 1998 - March 2000 % Australia New Zealand
Diabetic (n= 777) Diabetic (n=295) Other-NoAN (n=1860) Other-NoAN (n=308) New Patients Creatinine Clearance at EntryApril 1998 - March 2000 % Australia New Zealand
% HD (n=1904) % HD (n=250) % PD (n=1111) % PD (n=406) New Patients Creatinine Clearance at EntryApril 1998 - March 2000 % Australia New Zealand
% Australia % New Zealand Early Start Treatment April 1998 - March 2000Proportion of New Patients with Creatinine Clearance 10 mls/min Referral Total Aust 777 190 377 1860 1356 1848 1143 928 2419 785 NZ 295 4 88 308 269 426 268 146 510 185
Creatinine Clearance at Entry to Program New Patients - Aged 55-64 Years Australia 1-Apr-1998 to 31-Mar-2000 Cumulative % Creatinine Clearance mls/min
Creatinine Clearance at Entry to Program New Patients - Aged 65-74 Years Australia 1-Apr-1998 to 31-Mar-2000 Cumulative % Creatinine Clearance mls/min
Creatinine Clearance at Entry to Program New Patients - Aged 55-64 Years New Zealand 1-Apr-1998 to 31-Mar-2000 Cumulative % Creatinine Clearance mls/min
Creatinine Clearance at Entry to Program New Patients - Aged 65-74 Years New Zealand 1-Apr-1998 to 31-Mar-2000 Cumulative % Creatinine Clearance mls/min