Download
1 / 25
250 likes | 372 Views
Findings from 2014 Staff Satisfaction Survey. April 8, 2014. Agenda. Research Overview Key Survey Findings Conclusions. Research Overview. Research Overview. Research Overview. Minor updates from 2013 questions Invited all staff and faculty to participate

E N D
Findings from 2014 Staff Satisfaction Survey April 8, 2014
Agenda • Research Overview • Key Survey Findings • Conclusions
Research Overview Research Overview
Research Overview • Minor updates from 2013 questions • Invited all staff and faculty to participate • 82 out of 119 responded (about 70%) • Margin of error is ±6% at a 95% confidence level
Respondent Profile Cross-tabulations by each characteristic is provided in the report’s appendix.
Key Findings Detailed Findings
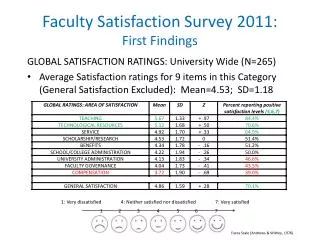
General Ratings - 2014 Working at New America School is good for most faculty and staff
Change Since 2013 Most ratings of the organization increased slightly, but ratings of job decreased
General Ratings by Location Highest overall ratings at New America College Lowest overall ratings at Thornton
Change Since 2013 Ratings improved at Aurora and Lakewood Ratings decreased at Thornton
Averages by Operations Area 2014 Results
Mission -5 = "strongly disagree" +5 = "strongly agree"
Evaluating Change in Mission Mission has changed, and the change is good
Board of Directors Ranked lowest, but positive and improving
Conclusions Conclusions
Key Findings • Working at NAS is good for most • High ratings of Job and School • Working at NAS is getting better for most • Greatest improvements in School and Reputation • Ratings increased at Aurora and Lakewood but dropped at Thornton • HR and Facilities rank highest • Faculty and staff feel safe
Key Findings • Biggest improvements in… • Curriculum • Facilities • Learning & Discipline • Mission & Policies • Board of Directors ranked lowest but still positive and improving • The mission has changed, and the change is good
Q&A Q&A