Download
1 / 13
130 likes | 147 Views
Resident Satisfaction Survey. May 2019. Ontario Resident Satisfaction Survey. Focused on: Resident satisfaction Public opinion on city priorities Challenges facing the city Evaluation of specific municipal departments and services. Survey Demographics.

E N D
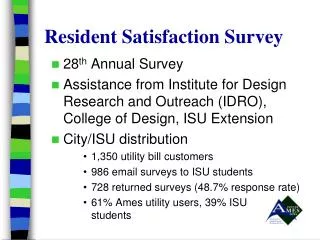
Resident Satisfaction Survey May 2019
Ontario Resident Satisfaction Survey Focused on: • Resident satisfaction • Public opinion on city priorities • Challenges facing the city • Evaluation of specific municipal departments and services
Survey Demographics • 51.4% Hispanic, 36% White, 6% Black, 2% Asian, 0.6% other • 25% elected to do the survey in Spanish • 44.6% of respondents have lived in Ontario over 25 years • 69% of residents own their own and 31% rent • 45.2% were retired/had no job • 17.6% worked in Ontario • Rose Institute determined that responses were consistent across demographic factors
The vast majority of respondents give Ontario a high ranking; 73% of people rank Ontario an “8” or above. “On a scale of 1 to 10, with 10 being the best, how would you rank Ontario as a community?”
85.8% of respondents are satisfied or very satisfied with the services they receive from the City of Ontario. “How do you feel generally about the services provided by the City of Ontario?”
91.6% of the respondents feel safe in Ontario. • 82% feel they get good value for public safety. “Do you feel safe in Ontario?” “Do you think you are getting good value for your public safety dollar?”
Satisfaction with City Agencies Average score of 81.8% of Very Satisfied & Satisfied Average score of 9.75% of Very Dissatisfied or Dissatisfied
Areas of Improvement: Respondents could choose more than one answer. The survey logged 648 suggestions. “What would be your suggestions to improve Ontario?” -Cost of Living -Development Impact -Homeless -Downtown -Neighborhood preservation -Nothing to suggest
27.4% of the respondents pick the Ontario Living Magazine as the best liked source for information about the city “Of the sources that you listed which one do you like best?”
Priorities for Ontario Residents identified their priorities for the future of Ontario Maintain Infrastructure
78.8% of respondents say the City of Ontario is headed in the right direction. “Generally speaking, would you say that things in the city of Ontario are headed in the right direction or in the wrong direction?”
2019 Resident Satisfaction SurveyKey Takeaways • Ontario is headed in the right direction, but we cannot rest on our laurels • How will we create and elevate the quality of life further? • Our community is diverse and has diverse opinions, and we should identify means of bringing our residents together • More community events, more programming in Ontario Ranch, and more “gathering spots” amid unique neighborhoods and commercial districts • Our residents want to be engaged and appreciate more meaningful communication • There is much to be proud of…share the good news and make people proud to be in Ontario, CA!!!
Creating the premiere community of the Inland EmpireOntarioCA.gov/ResidentSurvey