Download

1 / 15
150 likes | 190 Views
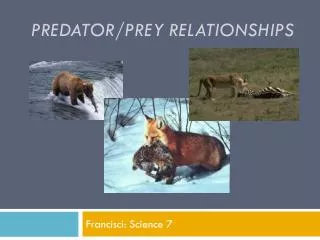
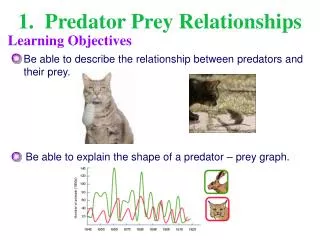
1. Predator Prey Relationships. Learning Objectives. Be able to describe the relationship between predators and their prey. Be able to explain the shape of a predator – prey graph. 5. Population Size. To do: Draw a concept map of what effects the size of a population. population grows.

E N D
1. Predator Prey Relationships Learning Objectives Be able to describe the relationship between predators and their prey. Be able to explain the shape of a predator – prey graph.
5. Population Size To do: Draw a concept map of what effects the size of a population. population grows Decrease in predators plenty of food food shortage Predators Food increase in predators POPULATION SIZE population falls overcrowding Disease increased aggression / competition for resources
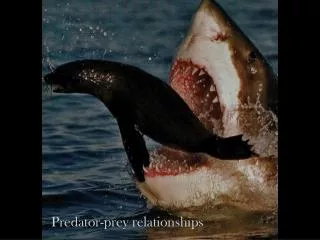
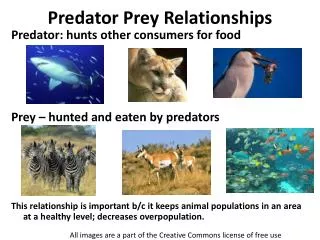
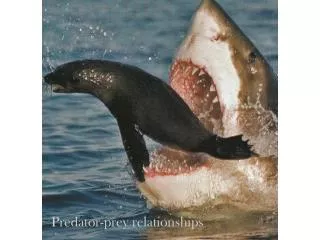
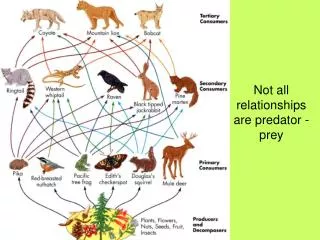
6. Animals that eat other animals Populations of animals are often limited by the amount of food. What are animals that eat other animals called? predators What are the animals that predators eat called? prey
7. Predator and prey adaptations How are predators and prey adapted to survive? Predatorsareadaptedtocatchingandconsumingtheirprey. predators Prey have adaptations to detect and prevent being eaten by predators. prey
venomous coral snake mimicry scarlet kingsnake speed & keen senses camouflage warning colors & patterns 8. Prey Adaptations – General Prey have adaptations to detect and prevent being eaten by predators.
venomous snakes have poisonous venom to subdue their prey birds of prey have keen eyesight and sharp beaks and talons camouflage allows predators to blend in with their surroundings kingsnakes are immune to the venom of venomous snakes treefrogs have special pads on their feet so they can cling to vertical surfaces 9. PredatorAdaptations – General Predators have adaptations to catch and consume their prey.
10. Can you find the camouflaged predators? 1 3 2 4 8 6 7 5 Some predator and prey adaptations are the same.
11. Predator & Prey adaptations -Eyes The eyes of predators face forwards. This gives them good depth perception allowing them to judge distances well. Can focus on a single point. The eyes of prey are located on the side of the head. This allows them to see to the side and rear while eating, without moving their head. Some prey have almost 360° vision.
12. The Lynx and the Snowshoe hare This is the most common example of the predator prey relationship.
13. Prey Adaptations – Snowshoe Hare The snowshoe hare lives in northern parts of North America. How is it adapted to the cold and to avoid being eaten by predators, such as lynxes? Coat changes colour with the seasons from greyish-brown in summer to white in midwinter. Large ears help to detect predators. Strong teeth are able to chew bark and twigs. Large back feet spread out to act as snow shoes. Fur on the soles also protectsfromthecold.
14. Predator adaptations – the lynx Lynxes are adapted to life in a cold climate. How are these predators adapted for catching the snowshoe hares that are their main prey? Excellent eyesight and hearing for detecting prey. Very sharp teeth – prey watch out! Thick furry coat protects from the cold. Very strong hind leg muscles are capable of a pounce 6.5 metres long! Extra large paws act as snow shoes on soft, deep snow.
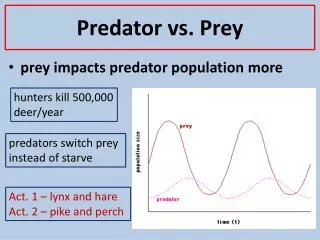
15. Predator–prey graph These graphs are a common exam question. You should know that: There are always more prey than predators. The prey always increases before the predators do.
18. Predator–prey graph section Why does the peak for the lynx population always come after the peak for the number of snowshoe hares? snowshoe hare 150 lynx For the populations to survive, there will always be more hares than lynxes. 100 estimated population size (thousands) 50 0 1850 1855 1860 1865 time (year)
prey population increases prey population increases predator population decreases as less food predator population increases as more food prey population decreases because of more predators 19. Predator–prey cycle Predator and prey population sizes follow a cycle. What happens if the prey population increases? normal prey population
prey population decreases prey population decreases predator population decreases as less food predator population increases as more food prey population increases because of less predators 20. Predator–prey cycle Predator and prey population sizes follow a cycle. What happens if the prey population decreases? normal prey population