Download
1 / 9
90 likes | 221 Views
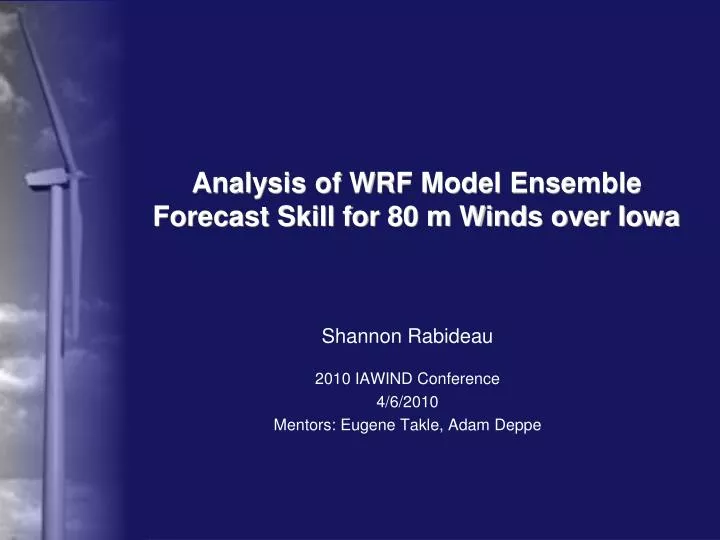
Analysis of WRF Model Ensemble Forecast Skill for 80 m Winds over Iowa. Shannon Rabideau 2010 IAWIND Conference 4/6/2010 Mentors: Eugene Takle , Adam Deppe. Motivation and Objective. Growing wind industry Unique/ limited data for 80 m Not extrapolated from surface.

E N D
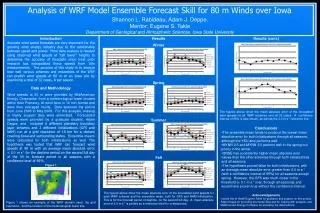
Analysis of WRF Model Ensemble Forecast Skill for 80 m Winds over Iowa Shannon Rabideau 2010 IAWIND Conference 4/6/2010 Mentors: Eugene Takle, Adam Deppe
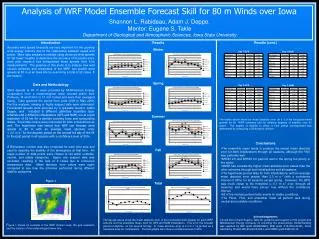
Motivation and Objective • Growing wind industry • Unique/ limited data for 80 m • Not extrapolated from surface • Hypothesis: WRF can forecast wind speeds at 80 m with an average mean absolute error less than 2.0 m s-1 for the forecast period 38-48hr (approximately 8am-6pm on day 2 of the 54hr forecast period) in all seasons with a confidence level of 95%.
Data • Observed: provided by MidAmerican Energy Corporation (MEC) • 10 min intervals, averaged hourly • Total of 32 cases, 8 per season • Forecasted: • 7 PBL schemes and ensemble mean • GFS and NAM initializations
Mean Absolute Error • Greater increase in MAE over time for NAM than for GFS • Ensemble mean performs best • (1.497 m s-1; 1.700 m s-1) • YSU close(+0.1 m s-1) • Blackadar(1.927 m s-1) and QNSE (2.106 m s-1) perform worst
Bias • GFS and NAM fairly comparable through the entire period • YSU has lowest avg. bias through period • (-0.130 m s-1; 0.106 m s-1) • Blackadar has highest by almost a factor of two • (-1.424 m s-1; -1.500 m s-1)
Day 2 Daytime • Significantly better results in spring? • Ensembles have lowest error • 1.529 m s-1 vs. 2.098 m s-1 • Blackadar (1.806 m s-1) worst - GFS • QNSE (2.421 m s-1) worst - NAM NAM GFS
Conclusions • Hypothesis true for GFS over all cases, but not all seasons • CI pushes summer, fall, and winter over 2.0 m s-1 threshold (by <0.1 m s-1) • Hypothesis false for NAM over all cases and all seasons • Ensembles and YSU most accurate schemes, QNSE least accurate
Further Research • Richardson Number • Model performance by stability categories • More cases and locations • Time of model initialization • Model perturbation ensembles • Thank you: Eugene Takle , Adam Deppe , MidAmerican Energy Corporation, and other members of Iowa State’s “wind team”.
References • Andersen, T. K., 2007: Climatology of surface wind speeds using a regional climate model. B.S. thesis, Dept. of Geological and Atmospheric Sciences, Iowa State University, 11 pp. • Archer, C. L., and M. Z. Jacobson, 2005: Evaluation of global wind power. J. Geophys. Res., 110, D12110. • Dudhia, J., cited 2009: WRF Physics. [Available online at http://www.mmm.ucar.edu/ wrf/users/tutorial/200909/14_ARW_Physics_ Dudhia.pdf] • Elliott, D., and M. Schwartz, 2005: Towards a wind energy climatology at advanced turbine hub-heights. Preprints, 15th Conf. on Applied Climatology, Savannah, GA, Amer. Meteor. Soc., JP1.9. • Klink, K., 2007: Atmospheric circulation effects on wind speed variability at turbine height. J. Appl. Meteorol. and Climatol., 46, 445-456. • Pryor S. C., R. J. Barthelmie, D. T. Young, E. S. Takle, R. W. Arritt, D. Flory, W. J. Gutowski Jr., A. Nunes, J. Roads, 2009: Wind speed trends over the contiguous United States. J. Geophys. Res., 114, D14105, doi: 10.1029/2008JD011416. • Takle, E. S., J. M. Brown, and W. M. Davis, 1978: Characteristics of wind and wind energy in Iowa. Iowa State J. Research., 52, 313-339. • University Corporation for Atmospheric Re-search, cited 2009: Tutorial class notes and user’s guide: MM5 Modeling System Version 3. [Available online at http://www. mmm.ucar.edu/mm5/documents/MM5_tut_Web_notes/MM5/mm5.htm] 9 • Zhang, D., and W. Zheng, 2004: Diurnal cycles of surface winds and temperatures as simulated by five boundary layer parameteriza-tions. J. Appl. Meteorol., 43, 157-169. • Wind turbine image: http://www.news.iastate.edu