Download
1 / 30
330 likes | 638 Views
Ensemble Air Quality Modeling Using the Coupled WRF-CMAQ Model. Robert Gilliam*, Christian Hogrefe *, James Godowitch *, Rohit Mathur *, Jun Du** *US EPA, **NOAA/NCEP. October 16, 2012. Outline. Background of ensemble approach Model configuration Variability of meteorological ensembles

E N D
Ensemble Air Quality Modeling Using the Coupled WRF-CMAQ Model Robert Gilliam*, Christian Hogrefe*, James Godowitch*, RohitMathur*, Jun Du***US EPA, **NOAA/NCEP October 16, 2012
Outline • Background of ensemble approach • Model configuration • Variability of meteorological ensembles • Response of CMAQ to ensemble meteorology inputs • Conclusions and future research goals
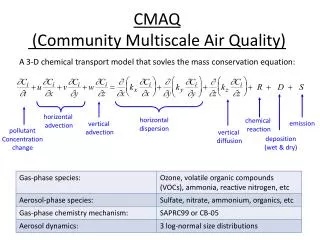
Background of Ensemble Approach • Grid nudging, or four dimensional data assimilation (FDDA), is used to drive our retrospective meteorological simulations for CMAQ. • FDDA analyses (U/V, T and Q) are generally obtained from national forecast model initial conditions archives. • FDDA analyses are computed using 3-D variational (3DVAR) data assimilation systems or objective analyses hybrid (Obsgrid), which produce a single best-fit of all observations collectively to a background field (typically short-term forecast). • In recent years, 3DVAR systems like NCEP’s GSI have adopted ensemble generation methods like breeding or ensemble transform (EnKF), which produce a range of initial conditions that represent statistically possible states of the atmosphere.
Background of Ensemble Approach: Main Research Questions • If an ensembles set of initial conditions are truly a representation of the uncertainty of the state of the atmosphere, can they be used to estimate the CMAQ uncertainty that results from variations in its meteorological inputs? • Can this CMAQ ensemble variability add value to our general understanding of inherent variability of single CMAQ simulations, like the expected error ranges or variability? i.e.; 8-hr max O3 of 78 ppb +/- 8 ppb
Short-Range Ensemble Forecast System (SREF) * NCEP Short Range Ensemble Forecast (SREF) System Upgrade in 2009 Jun Du, Geoff DiMego, ZoltanToth, DusanJovic, Binbin Zhou, Julia Zhu, Hui-Ya Chuang, Jun Wang, Henry Juang , Eric Rogers and Ying Lin (Environmental Modeling Center, NCEP/NOAA, Camp Springs, Maryland) *
General Ensemble Configuration • Used Short-Range Ensemble Forecast (SREF) system’s initial conditions each 6 hours for FDDA. • Used the two-way WRF-CMAQ model (no feedback) on the 12 km CONUS grid. • Ran single WRF-CMAQ for a 10 day spin-up period (May 27-June 5) prior to the ensemble modeling period using 2006 emissions. • Generated separate wrffdda_d01 files for 15 SREF membersusing WRF’s real.exe. • Ran 15 member ensemble for a 4-day high ozone case where the only difference was the ensembles FDDA fields above the PBL. • Examined the variability of WRF, WRF model performance, transport trajectories and CMAQ performance from a probabilistic perspective.
June 8, 2011 Note: Maps were developed by NOAA/NCEP/HPC http://www.hpc.ncep.noaa.gov/dailywxmap/ • Four-day case (Jun 6-9, 2011) study represents a classic eastern US elevated ozone regime. • Bermuda high pressure expands influence to entire eastern US (above). • Warm temperatures, clear skies and low precipitation (top-right) are reflection of subtropical high’s influence. • Southerly flow becomes conveyor belt of ozone and precursors to the highly populated northeast US. (AirNow maps) June 8
WRF-CMAQ Ensemble Std. Dev. PBL Height (m) 10 m Wind Speed (m/s) Shortwave Rad(W/m^2) 500 m Ozone (ppb)
Variability of Ensemble RMSE (T2m) • Std. Dev. of Ensemble RMSE is generally below 0.20 K when ensemble RMSE is low (< 2.0K) • Higher ensemble error and variability of error exists in the Midwest, Northeast where more active weather persisted over the study period • Variability in temperature RMSE shows ensemble does have a significant spread along frontal boundaries and during active weather regimes.
Variability of Ensemble RMSE (WS10m) • Mean ensemble RMSE generally low across most of the US (< 2 m/s). • Variability of Ensemble RMSE is mostly less than 0.2 m/s with some larger values along land water boundaries (i.e.; West Coast).
Single Level Ensemble Trajectories Sacramento Dallas Columbus Los Angeles Baltimore Trajectories are around 130 m agl with colors representing O3 concentrations (ppb) along the traj. June 7, 18 UTC to June 10, 00 UTC Houston Atlanta
Charlotte, NC 06/09/11 06/05/11 06/07/11
Ensemble O3 Predictions for US CitiesLos Angeles June 7 June 8 June 9 8-hr max O3 obs Baseline WRF-CMAQ Ensemble Distribution
Ensemble O3 Predictions for US CitiesBaltimore June 7 June 8 June 9
Probability (%) of 8-hr Ozone > 75 ppb June 6, 2012 June 7, 2012 June 8, 2012 June 9, 2012
Conclusions • Ensemble FDDA using SREF does produce significant variability in key meteorological parameter like clouds, radiation, PBL depth, lower tropospheric winds and temperature • This meteorological variability has in many instances, a large impact on CMAQ’s Ozone and CO concentrations. • This preliminary case study showed that in and around urban areas, max 8-hr Ozone can vary as much as 5-15 ppbbecause of meteorological input uncertainty passed to CMAQ.
Future ensemble research • Test longer term ensemble runs for the summer of 2012 with longer spin-up and up-to-date emissions with parallel baseline run using our standard WRF FDDA. • Perform ensemble simulations with reduced emissions to investigate the impact of inherent meteorological uncertainties on the modeling system response to emission controls and source/receptor relationships. • Explore other ensembles like the GFS, which is a single model 20 member ensemble, or the new SREF which will be reduced to 16 km grid scale, or possible our own ensemble through the GSI system on our model domain. • Develop more exact uncertainty levels of major pollutants • Use Ensemble FDDA to explore wintertime PM2.5 CONUS-wide, but also for specific problem areas like stable cold pools in areas of the Rockies (SLC).
Acknowledgements • NOAA-NCEP: SREF ensemble initial conditions for case study • NOAA/ESRL: MADIS observations used for WRF evaluation • US EPA’s AirNow program: AirNow ozone maps and observational AQ measurements • David Wong: WRF-CMAQ code and run scripts
WRF Ensemble Error (RMSE) Baseline Baseline Baseline
Baltimore, MD 06/09/11 06/07/11 06/05/11
Time Series of WRF and CMAQ Boston, MA 06/09/11 06/07/11 06/05/11
Ensemble O3 Predictions for US CitiesColumbus June 6 June 7 June 8 June 9
Ensemble O3 Predictions for US CitiesCharlotte June 6 June 7 June 8 June 9
Ensemble O3 Predictions for US CitiesDallas June 6 June 7 June 8 June 9
Ensemble O3 Predictions for US CitiesHouston June 6 June 7 June 8 June 9
Probability (%) of 8-hr Ozone > 65 ppb June 6, 2012 June 7, 2012 June 8, 2012 June 9, 2012
Probability (%) of 8-hr Ozone > 90 ppb June 8, 2012 June 9, 2012
Single-observation increments GSI EnKF hybrid Single 850 hPa Tvobservation (1K O-F, 1K error)
Why use EnKF for ensemble data assimilation and ensemble forecast initialization instead of operational ETR? • ETR (Ensemble transform with rescaling) • Not designed to represent 6-h forecast error covariances- viable for hybrid paradigm? • Update of breeding method to include orthogonalization of perturbations in analysis variance norm. • Virtually no additional computational cost beyond forward integration • Perturbations based on resizing to analysis-error mask derived for 500 hPa streamfunction • Tuned for medium range forecast spread and “fast error growth” • T190L28 version of the GFS model • EnKF • Perturbations specifically designed to represent analysis and background errors (parameters tuned by running DA stand-alone) • T254L64 version of the GFS • Extra computational costs worth it for hybrid?