Download
1 / 19
190 likes | 287 Views
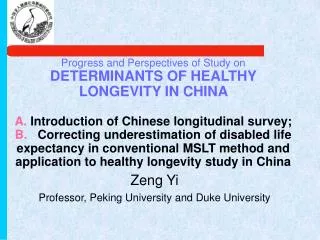
A Study on DETERMINANTS OF HEALTHY LONGEVITY IN CHINA A. Introduction of Chinese longitudinal survey on Healthy Longevity; B. Some Results of the Data Analysis. Zeng Yi. A. A BRIEF INTRODUCTION to Chinese Longitudinal Survey on Healthy Longevity.

E N D
A Study onDETERMINANTS OF HEALTHY LONGEVITY IN CHINAA.Introduction of Chinese longitudinal survey on Healthy Longevity;B.Some Results of the Data Analysis Zeng Yi
A. A BRIEF INTRODUCTION to Chinese Longitudinal Survey on Healthy Longevity • This is a Duke-PKU collaborative large project, aiming at • To better understand determinants of healthy longevity, such as social, economical, behavioral, environmental and biological factors. • To provide data information for academic research, health and aging policy analysis.
Progress of longitudinal surveys in 1998, 2000, and 2002 (1) Achieved sample size distributions. -- Extensive questionnaire data were gathered from 8,959, 11,161, and 11,163 oldest-old aged 80+ in 1998, 2000, and 2002, respectively. -- Among them, 8,170, 10,457, and 12,656 interviews were conducted with centenarians, nonagenarians, and octogenarians, respectively; -- Data on date/cause of death, health status, socioeconomic status, and degree/length of disability and suffering before dying, etc., were collected from 2,783, 2,406 and 1,449 deceased interviewees aged 100+, 90-99, and 80-89, respectively.
(2) Significant Extension of CLHLS study since 2002 -- Thanks to NIA, UNFPA, China Social Science Foundation, Peking University, Taiwan Academia Sinica and Mainland China Academy of Social Science, we added 4,894 younger elderly aged 65-79 and 4,478 elderly interviewees’ adult children aged 35-65 into our sample in 2002 wave. -- The total sample size is now over 20,000 interviewees including oldest-old (focus), younger elderly (as a comparison group) and elders’ adult children (intergenerational relations and healthy longevity).
Age Survival interviewees deceased (proxy interview) follow-up newly interview Total M F T M F T M F T M F T 1998 baseline survey 80-89 NA NA NA 1787 1741 3528 1787 1741 3528 NA NA NA 90-99 NA NA NA 1299 1714 3013 1299 1714 3013 NA NA NA 100+ NA NA NA 481 1937 2418 481 1937 2418 NA NA NA Total NA NA NA 3567 5392 8959 3567 5392 8959 NA NA NA 2000 follow-up survey 80-89 996 1048 2044 1471 1403 2874 2467 2451 4918 339 262 601 90-99 720 907 1627 925 1260 2185 1645 2167 3812 574 612 1186 100+ 262 891 1153 256 1022 1278 518 1913 2431 348 1213 1561 Total 1978 2846 4824 2652 3685 6337 4630 6531 11161 1261 2087 3348 2002 follow-up survey 35-65 NA NA NA 3132 1346 4478 3132 1346 4478 NA NA NA 65-79 NA NA NA 2456 2438 4894 2456 2438 4894 NA NA NA 80-89 1454 1411 2865 673 672 1345 2127 2083 4210 483 377 860 90-99 948 1236 2184 590 858 1448 1538 2094 3632 547 679 1226 100+ 277 917 1194 442 1685 2127 719 2602 3321 295 941 1236 Total 2679 3564 6243 7293 6999 14292 9972 10563 20535 1325 1997 3322 Sample Distribution, 1998-2002 NA -- Not applicable
(3) Sampling areas -- The survey was conducted in the randomly selected half of the counties and cities of 22 provinces out of the total of 31 provinces where Han are majority. -- The population in the survey areas constitutes about 85 percent of the total population in China.
PERSPECTIVE General plan of our 2005 and 2008 follow-up surveys 2. Further in-depth data analysis to better understand the determinants of healthy longevity Data Availability: The 1998 baseline and 2000 follow-up healthy longevity survey data is now being distributed internationally by the Peking University Center for Healthy Aging and Family Studies (http://www.pku.edu.cn/academic/population/center/index.htm) and the program project at Duke University (http://www.pubpol.duke.edu/centers/ppa/). The data processing and preliminary analysis of the 2002 follow-up survey are underway and the data sets of 2002 wave will be distributed internationally in October 2004. Contacts: Prof. Liu Yuzhi, Peking University; E-mail: chafs@pku.edu.cn or yuzhil@pku.edu.cn Dr. Danan Gu, Duke University;E-mail: danan@aas.duke.edu
B.Some Results of the Data Analysis (a) CORRECTING THE UNDERESTIMATION OF DISABLED LIFE EXPECTANCY: The CLHLS new data collection has led to a New Method & Application to the Oldest Old In China(Zeng, Gu, and Land, 2004)
Previous research has indicated that the underestimation of disability is one of the major problems in research on population aging (Gill et al. 2002; Guralnik and Ferrucci 2002) We found that extant studies of active/disabled life expectancy based on multi-state life table implicitly assume that persons who die between ages x and x+1 (or ages x and x+n) do not change their functional status between age x and time of death. Such unreasonable assumption has resulted in that the widely used disabled life expectancies based on conventional methods are significantly underestimated. Based on the unique CLHLS data on ADL before dying, we propose a new method to correct the underestimation of disabled life expectancy inherent in the MSLT method.
Results and Discussion 1. Underestimation of disabled life expectancy by classic MSLT method ① Proportion of underestimated disabled life expectancy by conventional MSLT method at age 80 are 10% and 6% for males and females respectively. With advancing of age, such underestimation declines ----the underestimation of disabled life expectancy is statistical significant. ② The underestimation of disabled life expectancy is larger for males than for females. • The underestimation of disabled life expectancy is around 12% and 6% for males and females at age 65 respectively based on the extrapolation.
Gill et al. (2002) demonstrated that prevalence ratesof disability at different waves with longer intervals between waves (e.g. 1-5 years) are substantially underestimated. Gill and colleagues proposed to substantially reduce the length of the observation intervals between interviews or using monthly telephone interviews ---- but largely increase the costs.
Age and gender differentials in status-based ALEafter correcting the underestimation of disabled life expectancy
Life table proportions of the extent of morbidity before dying among the oldest old who are active or disabled at initial ages The slight morbidity profile: refers to those who were ADL active & bedridden for <5 days (including not bedridden). • The moderate morbidity profile: refers to those who were ADL active & bedridden for ≥5 days or ADL disabled & bedridden for <5 days. • Severe morbidity profile: refers to those who were ADL disabled & bedridden for 5-59 days. • The long-term severe morbidity profile: refers to those who were ADL disabled & bedridden for ≥60 days.
(1)ADL disability at Survey is strongly associated with the extent of morbidity before dying. (2) As compared to their male counterparts, Chinese oldest old women not only survive in a more likely disabled status, but also suffer more before dying (3)Our empirical results show that the life table proportions of slight morbidity death over initial age y generally do not decline with the increase of age y ----This is generally consistent with previous similar studies and provides additional evidence concerning debates on the hypothesis about compression of morbidity (Fries 1980), or Morbidity dynamic equilibrium (Manton 1982). ---- reject the hypothesis of a pandemic of disability(Gruenberg 1977) ---- healthy longevity (i.e., achieving longevity while relatively compressing morbidity) is not impossible (Hubert et al. 2002)
(b) Positive Life Satisfaction & Healthy LongevityAge differentials of physical performance, activity of daily living, good cognitive function, self-reported good health and life satisfaction of the oldest old
We find that life value in terms of positive personality, optimistic attitudes and positive view of current life has beneficial effects on health and longevity. Such positive value should be advocated. Our unique data from the oldest-old aged 80-105 with largest survey sample size ever conducted have shown that life satisfaction and happiness is one of the secrets of healthy longevity.