Download
1 / 52

E N D
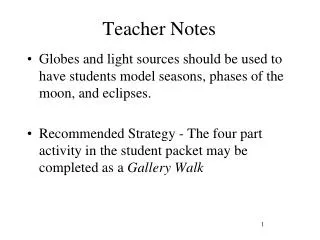
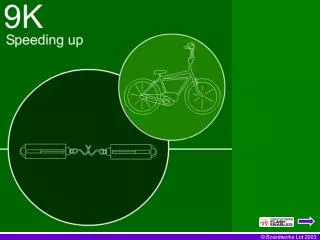
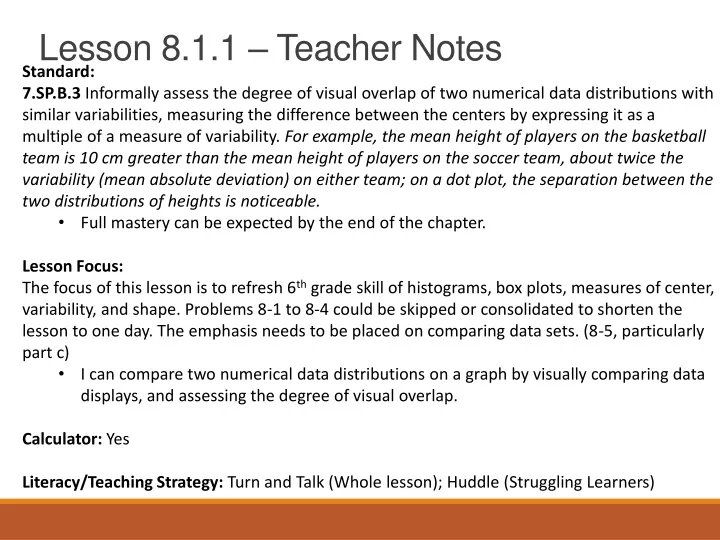
Lesson 8.1.1 – Teacher Notes • Standard: • 7.SP.B.3 Informally assess the degree of visual overlap of two numerical data distributions with similar variabilities, measuring the difference between the centers by expressing it as a multiple of a measure of variability. For example, the mean height of players on the basketball team is 10 cm greater than the mean height of players on the soccer team, about twice the variability (mean absolute deviation) on either team; on a dot plot, the separation between the two distributions of heights is noticeable. • Full mastery can be expected by the end of the chapter. • Lesson Focus: • The focus of this lesson is to refresh 6th grade skill of histograms, box plots, measures of center, variability, and shape. Problems 8-1 to 8-4 could be skipped or consolidated to shorten the lesson to one day. The emphasis needs to be placed on comparing data sets. (8-5, particularly part c) • I can compare two numerical data distributions on a graph by visually comparing data displays, and assessing the degree of visual overlap. • Calculator: Yes • Literacy/Teaching Strategy: Turn and Talk (Whole lesson); Huddle (Struggling Learners) .
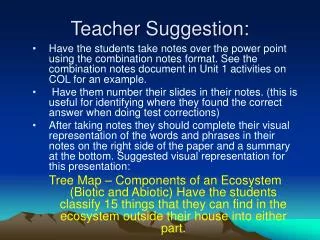
Lesson 8.1.1 Data Analysis UnitRepresenting Data Goal: I can represent data with plots on the real number line (dot plots, histograms, and box plots). S-ID.1
Objective - To make and interpret box-and-whisker plots used to represent data. 19 13 3 10 15 20 18 10 12 13 16 17 . Write the data in increasing order from smallest to largest. 3 10 10 12 13 13 15 16 17 18 19 20 Median lower half of data upper half of data 13 +15 = 14 2 Median of lower half Median of upper half 10 +12 17 +18 Lower Quartile Upper Quartile = 11 = 17.5 = = 2 2
3 10 10 12 13 13 15 16 17 18 19 20 Median = 14 Lower Quartile Upper Quartile = 11 = 17.5 . 0 5 10 15 20 25 Maximum 20 Lower Quartile 11 Upper Quartile 17.5 Median 14 Minimum 3 Range - Drawn from the minimum to the maximum. (Whiskers) Interquartile Range - Drawn from lower quartile to upper quartile. (Box)
Make a box-and-whisker plot to represent the data below. 11 2 5 7 6 13 25 8 11 12 22 Write the data in increasing order from smallest to largest. 2 5 6 7 8 11 11 12 13 22 25 Lower Quartile 6 Median 11 Upper Quartile 13 0 5 10 15 20 25
The box-and-whisker plots below represent the quiz scores from two different pre-algebra classes. What can you tell about how different the classes are? Period 2 0 5 10 15 20 25 Period 4 0 5 10 15 20 25 Period 4 performed better as a group with higher median, upper quartile, and lower quartile. The period 4 scores are also more tightly grouped together. Period 2 scores are more spread out.
Use the box-and-whisker plot below to find the following. 0 10 20 30 40 50 60 46 a) Minimum = 12 e) Upper Quartile = b) Maximum = 61 f) Lower Quartile = 24 61 - 12 c) Range = g) Interquartile Range = = 49 46 - 24 = 22 d) Median = 39
Make a box-and-whisker plot to represent the data below. 25 40 22 16 50 35 24 37 44 48 Write the data in increasing order from smallest to largest. 16 22 24 25 35 37 40 44 48 50 Median Lower Quartile 24 35 +37 Upper Quartile 44 = 36 2 0 10 20 30 40 50 60
Steps • Order the data from least to greatest. • Find the minimum and maximum values. • Find the median. • Find the lower and upper quartiles (medians of the lower and upper half). • Plot these five numbers below a number line. • Draw the box, whiskers, and a line segment through the median.
Box Plot A box encloses the middle half of the data and whiskers extend to the minimum and maximum data values median Q3 Q1 max min
We can describe data by talking about: Mean – (Average) adding all the numbers up and dividing by the total number of numbers.Median – the number found in the middle after arranging them from least to greatestMode – the number repeated the most Range – the difference found by subtracting the least number from the greatest number.
Whether we are talking about a Dot plot, Histogram, Bar graph we can describe the shape.
In some cases you can have an outlier….. A number situated away or detached from the main body or system of numbers
Dot Plots How many of each color of M&M are in a package Frequency Colors
Graph paper is a good idea for it is crucial that each recorded X be uniform in size and placed exactly across from each other (one-to-one correspondence).Notice the cluster at 17 & 18 as well as the gap at 13 and 22. The mode is 18, the median is the second X from the bottom for number 18, and the mean is 17.68 or 18. Dot Plot for the Number of M&M's™ in a Package Frequency Number of M&M in a Package
What do you notice about the difference of a Histogram and a Bar Graph???
Histograms . In a histogram, data are grouped into intervals of EQUAL width. The number of data values in each interval is the frequency of the interval. To draw, begin by using a frequency chart (tally chart) and making a frequency distribution (intervals). Histogram typically contain 5-10 intervals.
Histograms 2009-2010 Mean SAT Math Scores
Relating Histograms to Box Plots . • http://higheredbcs.wiley.com/legacy/college/mann/0470444665/applets/applet_01_v4.html
Day II . • How to analyze data of a box plot. • https://learnzillion.com/lesson_plans/6527-compare-box-plots-using-center-and-spread/lesson • How to interpret Histograms • https://learnzillion.com/lesson_plans/6826-interpreting-histograms/ • Observing symmetry, bell curves and skews. • https://learnzillion.com/lesson_plans/7751/
Dot Plot http://stattrek.com/statistics/charts/dot-plot.aspx?tutorial=ap