Download
1 / 36
370 likes | 519 Views
Teacher’s Notes. A slide contains teacher’s notes wherever this icon is displayed - To access these notes go to ‘Notes Page View’ (PowerPoint 97) or ‘Normal View’ (PowerPoint 2000). Notes Page View. Normal View. Flash Files.

E N D
Teacher’s Notes A slide contains teacher’s notes wherever this icon is displayed - To access these notes go to ‘Notes Page View’ (PowerPoint 97) or ‘Normal View’ (PowerPoint 2000). Notes Page View Normal View Flash Files A flash file has been embedded into the PowerPoint slide wherever this icon is displayed – These files are not editable.
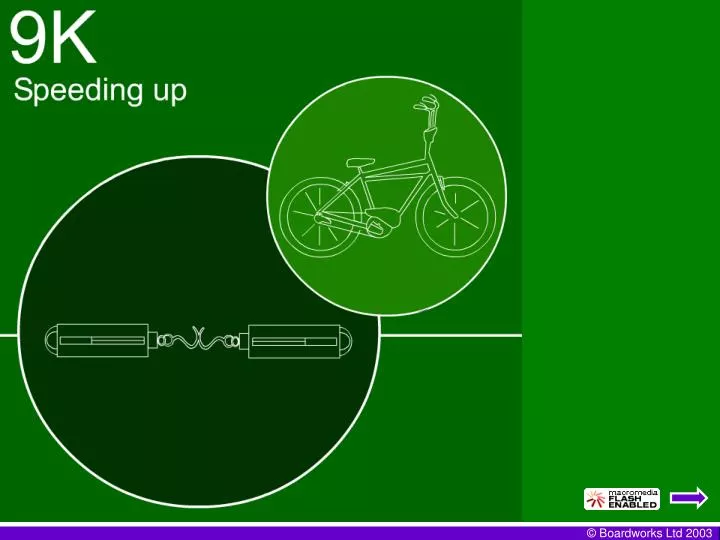
Distance, Time and Speed • To work out the speed of an object you need to know: • the distance traveled • how long it took to travel that distance
Formula triangle Formula triangle Use this equation: SPEED = d distance time s x t Speed is measured in many different units, e.g. m/s, km/h, km/s, miles per hour. The units of distance and time used will give the units to be used for speed.
Examples A boy travels from his home to the cinema, a distance of 10 km in 1 hour. Calculate his speed in km/h. d (distance in km) Speed in km/h = t (time in h) d 10 km = 1 h s x t = 10 km/h Cover the quantity you want to calculate - s (speed)
1x60x60 You sometimes have to change the units in this type of problem - here is the same problem again A boy travels from his home to the cinema, a distance of 10 km in 1 hour. Calculate his speed in m/s. (1km = 1000m) d (distance in m) Speed in m/s = t (time in s) d 10,000 m = 3600 s s x t = 2.8 m/s Cover the quantity you want to calculate - s (speed) Click for solution
Questions 1. A group set off from home and walk at an average speed of 3.6 km/h. How far would they travel in 2 hours? Give your answer in km. d s x t Click for solution Distance (km) = Speed (km/h) x time (h) = 3.6 km/h x 2 h = 7.2 km
2. How long would it take a woman to walk 10 km if her average speed is 5.4 km/h ? distance Time = Time = Time = 1.85 hours speed d 10 km 5.4 km/h s x t Click for solution
Car Graphing Activity This graphing experiment shows a movie of a car travelling along a straight road. Copy the results table shown on the next slide and complete it as the movie is played. Record the distance the car has travelled every five seconds. Then graph your results.
0 16 76 186 234 484 634 784 904 974 994 994 Results table for Distance / Time Graph
The car is starting to move. The curve shows that the speed is changing. The curve is upwards as the car accelerates at the start of the movie. The car is going fast but at a constant speed. The line is straight in this region of the graph. The car has stopped: The line is flat – the distance of the car from the start point is not changing. The line is straight – meaning that there is no CHANGE in speed. The line on the graph is not straight, so we know the speed of the car is changing. The curve is downwards as the car slows down at the end of the movie.
Gradient of a Distance / Time Graph The speed of the car can be calculated by looking at the gradient of the Distance / Time graph. Speed is “Distance Travelled divided by Time Taken” Both these values can be read off the Distance / Time graph, and this is the same as the gradient of the line.
Look at the straight line part of this graph shown by the two arrows in a triangle. The car has travelled from 200m to 800m, = 600m The car has taken from 16s to 36s to travel this distance = 20 seconds Therefore the speed is 600 divided by 20 = 30 m/s
Experiments - Speed 1. Time how long it takes you to run 100m. 2. Then calculate your speed for the run. SPEED (m/s) = 3. Repeat the experiment for each member of your group. What was the fastest speed for your group ? Distance (m) Time (s)
Results Name distance (m) time (s) speed (m/s) 100 100 100 100 100 Conclusion The fastest member of the group with a speed of ______ was _______.
What is a force? A force is a push, pull or twist. Click on the arrows to see the force!
More balanced and unbalanced forces Think of a car traveling at a constant 50 mph. The engine provides sufficient force to just overcome all the frictional forces that are acting to decrease the speed. 500 N 50 mph 500 N
Now a cross-wind acting on the car produces a sideways force. 50 mph Cross wind This causes the direction of the car to change. This happens because the sideways forces on the car are not balanced. If the car turns right so that the wind is now BEHIND the car, what will happen to the speed?
> 50 mph 500 N 400 N 500 N 60 mph 500 N The air resistance will decrease because the car has a “tail wind” (it is being blown from behind). This means the forces acting on the car are no longer balanced. The car will increase in speed (accelerate) until the forces are balanced again.
Summary • If the forces on an object are balanced : • If it isstopped it will remain stopped. • If it ismoving then it will continue to move at the same speed and in a straight line. • In other words, it will continue to do what it is already doing without any change. • If the forces are unbalanced two things can happen • Thespeed will change. • Thedirectionof motionwill change. • This is called acceleration.
A resultant force of 100 N is accelerating the car. 100 N Resultant forces The sum effect of more than one force is called the resultantforce. You can find out the resultant force by calculating the difference between opposing forces. 400 N 500 N
Find the resultant force: 1. 5N 5N Click for solution 10N 20N Resultant force = 20N -10N = 10N down The block will accelerate down.
5N 2. 5N Click for solution 5N 5N Resultant force = 5N - 0N = 5N right. The vertical forces are equal in size and opposite in direction so there is no resultant force in the vertical direction. The block will accelerate to the right.
17N 7N 3. 3N 10N 20N 13N 10N Click for solution Resultant force = 30 - 13 = 17N right. The vertical forces are equal in size and opposite in direction so there is no resultant force in the vertical direction. The block will accelerate to the right.
Friction Friction always tries to slow moving object down. We say it opposes motion. Friction is created whenever two touching objects or surfaces move past each other. Friction also occurs when things move through air. This is called air resistance or drag. The size of the frictional force equals the applied force UNLESS it is bigger than the MAXIMUM value of the frictional force. If this is the case then the frictional force remains at the maximum possible value.
Friction Brake pad and rim Pedal bearing Wheel bearing Wheel bearing Links in chain tyre and road On the diagram label all sources of friction. Click for answers Air resistance, or “Drag” One more? Probably the most important…
Air resistance or drag 400 N 300 N • Air resistance is a type of friction caused when objects move through the air. • Cars are designed so that they are streamlined. • The flow of air around the body is made as smooth as possible so that air resistance is minimized. • Air resistance depends on: • the size of the car; • the shape of the car; • the speed of the car.
Other sources of friction in cars One of the most important sources of friction in cars in that between the tyre and the road. When the car brakes, the maximum possible amount of friction is desirable so that the car does not skid. • The friction between the tyre and the road is affected by: • inflation pressure of the tyre • the road surface • surface condition caused by the weather (rain, ice, etc).