Download
1 / 31
310 likes | 515 Views
The power of gene expression profiling to unravel behaviour. Cathy Fernandes, Jose Paya-Cano, Frans Sluyter, Ursula D'Souza, Robert Plomin, Leonard C Schalkwyk. Social, Genetic and Developmental Psychiatry Centre Institute of Psychiatry King ’ s College London. Outline. Background.

E N D
The power of gene expression profiling to unravel behaviour Cathy Fernandes, Jose Paya-Cano, Frans Sluyter, Ursula D'Souza, Robert Plomin, Leonard C Schalkwyk Social, Genetic and Developmental Psychiatry Centre Institute of Psychiatry King’s College London
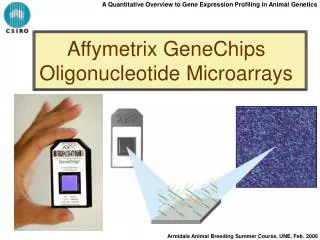
Outline • Background • Gene expression using the Affymetrix GeneChip system • Hippocampal gene expression profiles across eight • different inbred mouse strains • Hippocampal gene expression and cognitive ability
Microarrays, Mice & Behavioural Genetics • the interaction of multiple genes and their products • a snapshot of the simultaneous gene expression across • thousands of genes • mice are excellent models • genetic overlap with humans • differences in behaviour and gene expression • genomic information • access to fresh brain tissue nominate new candidate genes for behaviour
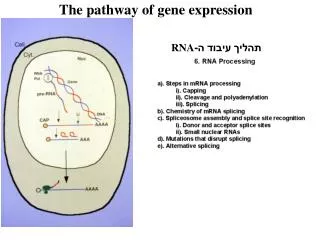
Gene expression studies using microarrays • Sandberg et al (2000) • six brain regions in 129SvEv and C57BL/6 • 24 genes strain-specific expression across all brain regions • (240 genes regional gene expression differences) • re-analysis by Pavlidis and Noble (2001) identified many more • genes with strain-specific (63 genes) and/or region-specific • (600 genes) expression • Gene expression profiles • during development (Mody et al, 2001) • resulting from ageing (Jiang et al 2001, Lee et al, 2000) • behavioural manipulations (Leil et al, 2002) • environmental manipulations (Rampon et al, 2000)
Hippocampal gene expression profiling across eight inbred mouse strains • AIMS • determine how much gene expression is due to genetic variation • to expand on the currently available gene expression data by • increasing the number of mouse strains studied • to find biologically relevant strain differences in gene • expression, filtering out random individual differences • to produce tightly controlled, replicated data • reliable pattern of gene expression • maximise detection of relatively small differences in expression
Selection of inbred strains • Selected from Group A of the Mouse Phenome Database • commonly used strains with available genetic and phenotypic • information • progenitors in transgenesis and mutagenesis studies • progenitors of recombinant inbred, consomic and congenic • strains A/J* BALB/cByJ C3H/HeJ DBA/2J* 129S1/SvImJ* C57BL/6J # FVB/NJ SJL/J * Celera Mouse Genome Sequencing Projects # Public Mouse Genome Sequencing Projects • differ in activity, exploration, anxiety, learning, aggression
The role of the hippocampus • key area of the brain involved in behaviours such as • learning/memory and anxiety • discrete area and is of a sufficient size in the mouse to • allow a precise and highly reproducible dissection • - yield sufficient quantities of mRNA for microarray work • strain-specific gene expression (Sandberg et al, 2000)
Procedure • male mice (6 per strain, 48 mice in total) from Jackson Laboratories (USA) aged 5-6 weeks • acclimatised in our barrier facility for 8 weeks (singly housed) • killed by cervical dislocation, in a randomised order, • aged 13-14 weeks (over 3 days to minimise any effect of time of day) • hippocampus was immediately dissected out, snap frozen on dry ice and stored at –80 0C • dissections done by the same operator and completed within 1 minute for each mouse
Procedure • (contd) • The following procedures were carried out to minimise stress to the mouse prior to killing: • minimal handling of mice • transported to the procedure room in their home • cage and killed within 3 minutes of transport • method of kill • killed by the same operator
Analysis • The data was analysed in parallel using Affymetrix • MAS5 and Li and Wong PM-only model (dChip v1.2, • Li and Wong 2001a) • differ in methods used to summarise the probesets and for normalisation of the arrays • 2. Signal values analysed in R • (http://www.r-project.org/, Ihaka & Gentleman 1996, Neuwirth & Baier 2001) • one-way ANOVA (results were filtered using a p value • cut-off of 4 x 10⁻⁶ (p≤ 0.05 following Bonferroni • correction for 12,488 probesets) 3. Hierarchical clustering (Eisen, 1998) was carried on the ANOVA filtered (p < 4 x 10⁻⁶) gene expression levels
Results • strain means for the probesets fit a normal distribution • - 252 (MAS5) and 200 (dChip) probesets with p values for • difference of < 4x 10⁻⁶ • 100 probesets were identified in both analysis programs • - discrepant probes most commonly are those of low signal • many of the strain differences due to up or down-regulation, • rather than presence or absence, of the transcript - the bulk of the probesets expression profiles are very similar (pairwise correlations between chips MAS5: 0.894 - 0.997, dChip: 0.901 - 0.997)
Clustering - numerous and clear strain differences in gene expression
Clustering(contd) - strains cluster together (in 10 different random permutation runs of the strain factor to assess the false positive rate, only two p-values < 4 x 10⁻⁶ were found (i.e. 1000 fold fewer than with the real factor)
Clustering(contd) • among clusters of probesets, several reunite multiple probesets • representing the same transcript • for example, four caspase 9 probesets cluster together (more highly • expressed in BALB/cByJ and C3H/HeJ) • many can be identified which are biologically plausible • for example, one striking cluster includes 5 loci from the H2 region of chromosome 17: H2-d (3 probesets), H2-k, and Qa, which are expressed above the mean in FVB/NJ and DBA/2J (BUT does not correlate with the H2 haplotypes of the strains)
Effect of gene mutation on expression • increased expression of Alad in DBA/2J compared to • C57BL/6J strain (gene is present in two copies in DBA • and one in C57BL/6J), Claudio et al (1997)
Effect of gene mutation on expression - Gas5 gene is known to harbour mutations that affect the stability of its mRNA transcript in the 129 substrains (Muller et al 1998)
Some potential candidates • microtubule-associated protein tau has key structural functions and is essential to beta-amyloid-induced neurotoxicity • preliminary data on protein levels (Western blots) support the • expression RNA data (D'Alcontres and Hanger, Neuroscience, IoP)
Some potential candidates • a keybifunctional enzyme in the activation of neuropeptides • gene maps to chromosome 1 at 57.5 cM (an ethanol-inducedloss of • righting reflex locus at chr 1,43 and 59 cM)
Some potential candidates - Camk2a is implicated in the establishment of long-term potentiation (Bejar et al 2002) and spatial learning (Silva et al 1992, Giese et al 1998) - BUT does not correlate with learning in these strains ?
Correlation • more and more phenotype data for inbred strains is available • it may be possible to find meaningful correlations with expression data (WebQTL) • similar to Grupe et al in silico genetic mapping • shortcomings also resemble Grupe
Aggression • Consensus aggression ranking (intermale offensive aggression), Sluyter: FVB/NJ> SJL/J> BALB/cByJ> C3H/HeJ> DBA/2J> C57BL/6J> 129S1/SvImJ> A/J • Spearman correlation with our chip data:
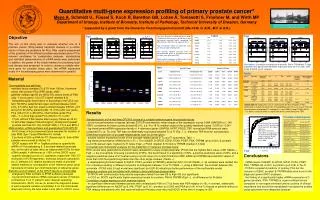
COMT expression correlation 550 500 COMT 450 400 350 1 2 3 4 5 6 7 8 Strain ranks • link between low COMT activity and increased aggression in mice • and humans (Gogos et al, 1998; Lachman et al, 1998; Jones et al, • 2001)
Limitations - biased towards detection of abundantly expressed, well- characterised genes - rare transcripts, short half-life, alternative splicing BUT low-abundance mRNAs or those expressed only at very specific times in development and/or processes may be key to determining the behavioural phenotype • - cellular heterogeneity • polymorphisms may obscure differences or create • spurious ones
Results (contd) Multiple probesets • one third of the highly significant probesets have one or more additional probesets representing the same transcript • compare or combine multiple probesets
History of inbred strains- analysis of CIDR data (http://www.cidr.jhmi.edu/) by Schalkwyk et al (1999) HS progenitor strains Wagner parsimony analysis using MIX (Felsenstein 1988b) of microsatellite data (298 loci from all 19 autosomes and X) on 48 strains, transformed into binary characters according to Schalkwyk et al 1999, and using SPRET as outgroup. Internal figures are the number of bootstrap replicates out of 100 supporting each group. The overall topology agrees with Schalkwyk (1999) except that the C57 and 129 groups are reversed.