Download
1 / 28
290 likes | 443 Views
A Quantitative Overview to Gene Expression Profiling in Animal Genetics. Affymetrix GeneChips Oligonucleotide Microarrays. Armidale Animal Breeding Summer Course, UNE, Feb. 2006. A Quantitative Overview to Gene Expression Profiling in Animal Genetics.

E N D
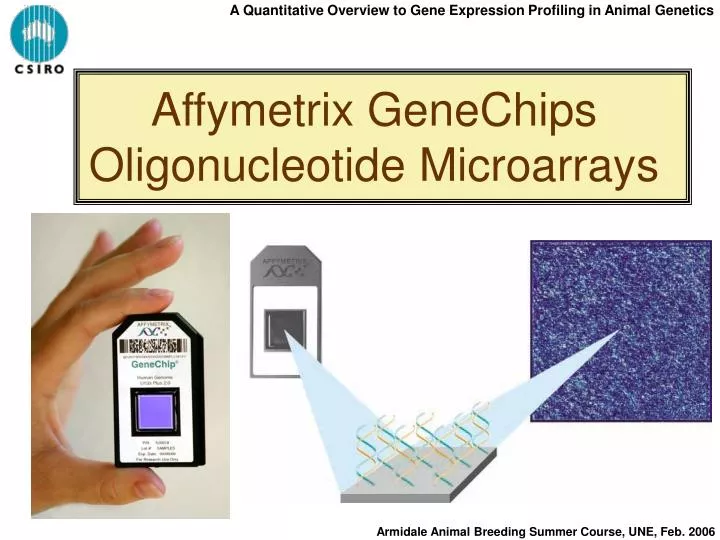
A Quantitative Overview to Gene Expression Profiling in Animal Genetics Affymetrix GeneChips Oligonucleotide Microarrays Armidale Animal Breeding Summer Course, UNE, Feb. 2006
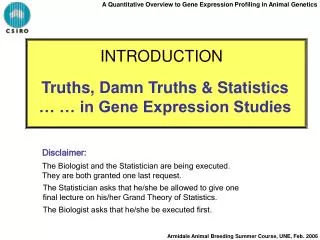
A Quantitative Overview to Gene Expression Profiling in Animal Genetics Many commercial microarray platforms are available: Plus a variety of custom cDNA arrays Armidale Animal Breeding Summer Course, UNE, Feb. 2006
A Quantitative Overview to Gene Expression Profiling in Animal Genetics Affymetrix Chips Armidale Animal Breeding Summer Course, UNE, Feb. 2006
A Quantitative Overview to Gene Expression Profiling in Animal Genetics Affymetrix Chips Bovine Dog Chicken Pork Armidale Animal Breeding Summer Course, UNE, Feb. 2006
A Quantitative Overview to Gene Expression Profiling in Animal Genetics Affymetrix Chips Examples of publicly availablegene expression data repositories • ArrayExpress - A public repository for microarray based gene expression data maintained by European Bioinformatics Institute. • ChipDB - A searchable database of gene expression • Gene Expression Atlas - A database for gene expression profile from 91 normal human and mouse samples across a diverse array of tissues, organs, and cell lines. • Gene Expression Database (GXD) - A database of Mouse Genome Informatics at the Jackson laboratory. • Gene Expression Omnibus - A database in NCBI for supporting the public use and disseminating of gene expression data. • MUSC DNA Microarray Database - MUSC DNA Microarray Database is a web-accessible archive of DNA microarray data. • NASCArrays - a repository for Affymetrix data generated by NASC's transcriptomics service. • Public Expression Profiling Resource (PEPR) - A web oracle data warehouse of quality control and standard operating procedure (QC/SOP) Affymetrix data. Reference. Armidale Animal Breeding Summer Course, UNE, Feb. 2006
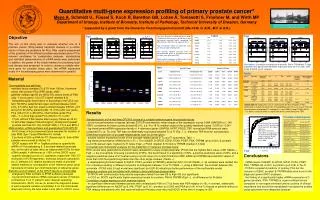
A Quantitative Overview to Gene Expression Profiling in Animal Genetics * * * * * Affymetrix Chips Hybridized Probe Cell GeneChipProbe Array Single stranded, labeled RNA target Oligonucleotide probe 24µm Millions of copies of a specific oligonucleotide probe 1.28cm >200,000 different complementary probes Image of Hybridized Probe Array Armidale Animal Breeding Summer Course, UNE, Feb. 2006
A Quantitative Overview to Gene Expression Profiling in Animal Genetics Affymetrix Chips Armidale Animal Breeding Summer Course, UNE, Feb. 2006
A Quantitative Overview to Gene Expression Profiling in Animal Genetics Affymetrix Chips Armidale Animal Breeding Summer Course, UNE, Feb. 2006
A Quantitative Overview to Gene Expression Profiling in Animal Genetics Affymetrix Chips Armidale Animal Breeding Summer Course, UNE, Feb. 2006
A Quantitative Overview to Gene Expression Profiling in Animal Genetics Affymetrix Chips Terminology Probe A 25mer oligo complemetary to a sequence of interest, attached to a glace surface on the probe array. Perfect Match (PM) Probes that are complementary to the sequence of interest. Mismatch (MM) Probes that are complementary to the sequence of interest except for homomeric base change (A-T or G-C) at the 13th position. Probe Pair A combination of a PM and a MM. Probe Set A set of 11 – 20 probe pairs. Armidale Animal Breeding Summer Course, UNE, Feb. 2006
A Quantitative Overview to Gene Expression Profiling in Animal Genetics Affymetrix Chips Terminology Armidale Animal Breeding Summer Course, UNE, Feb. 2006
A Quantitative Overview to Gene Expression Profiling in Animal Genetics Affymetrix Chips Armidale Animal Breeding Summer Course, UNE, Feb. 2006
A Quantitative Overview to Gene Expression Profiling in Animal Genetics Affymetrix Chips Pros and Cons of Affymetrix • Advantages: • Conditions are precisely controlled, chips are identical and can be compared • Only unique part of sequence is chosen – detection of closely related genes or splice variants is possible • Disadvantages: • The sequences are chosen based on a contemporary UniGene release and might get revised • Short probes may result in less specific hybridization and reduced sensitivity • (Agilent prefers 50-100mers) • Expensive!!! We often have to resort to cDNA arrays Armidale Animal Breeding Summer Course, UNE, Feb. 2006
A Quantitative Overview to Gene Expression Profiling in Animal Genetics Affymetrix Chips Bridging Platforms Petersen et al. (2005) Three microarray platforms: an analysis of their concordance in profiling gene expression. BMC Genomics 6:63. “The overall correlations between platforms were in the range 0.7 to 0.8. When concordance was measured for expression ratios significant at P < 0.05, the agreement among the platforms was very high, ranging from 93% to 100%” Many other references comparing platforms with mixed results: Pessimistic at the beginning (ie. 2000’s), more optimistic later on (…as the analysis methods to compare were more sophisticated). Ferl et al. (2003). Extending the utility of gene profiling data by bridging microarray platforms. PNAS 100:10585. (referring to Wright et al. 2003, PNAS 100:9991). Armidale Animal Breeding Summer Course, UNE, Feb. 2006
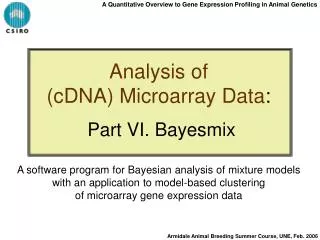
A Quantitative Overview to Gene Expression Profiling in Animal Genetics Affymetrix Chips Ferl et al. (2003) Linear Predictor Score 27 DE in cDNA Of which 14 were present in the Affy chip. X’s = Affy expression levels a’s = t-stats from cDNA data Armidale Animal Breeding Summer Course, UNE, Feb. 2006
A Quantitative Overview to Gene Expression Profiling in Animal Genetics Affymetrix Chips Converting the signal intensity into numeric values R = (PM-MM)/(PM+MM) Discrimination Score of a Probe Pair. Discrimination score R describes the ability of a probe pair to detect its intended target. If R is close to 1.0 in a majority of pairs in a set, the detection p-value will be lower PM MM Discrimination Score of each probe pair is compared tot - user defined value (default =0.0015) If (PM-MM)/(PM+MM)>t, then probe set is excluded Increasing t can reduce the number of false positives, but the true present calls might be lost. Armidale Animal Breeding Summer Course, UNE, Feb. 2006
A Quantitative Overview to Gene Expression Profiling in Animal Genetics Affymetrix Chips Converting the signal intensity into numeric values R = Discrimination Score R = (PM-MM)/(PM+MM) Discrimination score of each probe pair is compared to t (default =0.0015) Armidale Animal Breeding Summer Course, UNE, Feb. 2006
A Quantitative Overview to Gene Expression Profiling in Animal Genetics P-value of a probe set a1a2 Present Marginal Absent Default: 0.04 0.06 Affymetrix Chips Converting the signal intensity into numeric values A one-sided Wilcoxon’s Signed Rank test is the statistical method used to calculate the Detection P-value that reflects the significance of the differences between PM and MM. It assigns each probe pair a rank based on how far the probe pair Discrimination Score is from t P-value or statistical significance of a result is the probability that the observed change in a sample occurred by pure chance. a1 and a2 are user defined values but have optimized defaults in the software Armidale Animal Breeding Summer Course, UNE, Feb. 2006
A Quantitative Overview to Gene Expression Profiling in Animal Genetics Affymetrix Chips Converting the signal intensity into numeric values • Each probe pair in a probe set is considered as having a potential vote in determining the Signal value. • The real signal is estimated by taking the log of the Perfect Match intensity after subtracting the slide signal estimate (CT: Background correction across the entire array). • Subsequently, an expression call flag is assigned to each probe set: P gene is expressed (Present) M gene is Marginally expressed A gene is not expressed (Absent) Armidale Animal Breeding Summer Course, UNE, Feb. 2006
A Quantitative Overview to Gene Expression Profiling in Animal Genetics Affymetrix Chips Conclusions • Affymetrix arrays can give absolute expression values for a given gene. The software generates a call : Present, Marginal or Absent as well as a numeric value for expression level. • There is a number of “user defined” values used in calculations that we should be aware of while extracting the data. • Default software values guarantee very stringent cut-offs. The stringency of call generation can be manually changed to include more genes. Armidale Animal Breeding Summer Course, UNE, Feb. 2006
A Quantitative Overview to Gene Expression Profiling in Animal Genetics Affymetrix Chips Possible Problems • What if • a small number of the probe pairs hybridize much better than the rest? • removing the middle base does not make a difference for some probes? • some MM are PM for some other gene? • there is need for normalization? Armidale Animal Breeding Summer Course, UNE, Feb. 2006
A Quantitative Overview to Gene Expression Profiling in Animal Genetics Affymetrix Chips Example Armidale Animal Breeding Summer Course, UNE, Feb. 2006
A Quantitative Overview to Gene Expression Profiling in Animal Genetics Each represents the average Mismatch-corrected intensity of 11 – 20 Probe Pairs! Affymetrix Chips Example Data for a Single Chip Probe ID Intens. Flag P-Value 24,128 Armidale Animal Breeding Summer Course, UNE, Feb. 2006
A Quantitative Overview to Gene Expression Profiling in Animal Genetics Proportions are approx. constant for all chips. Increasing intensity from A to M to P. Very good variance stabilisation. Example Affymetrix Chips Data for a Single Chip For all 15 Chips Armidale Animal Breeding Summer Course, UNE, Feb. 2006
A Quantitative Overview to Gene Expression Profiling in Animal Genetics Affymetrix Chips Example Use all data and include Flag in the definition Comparison Group Armidale Animal Breeding Summer Course, UNE, Feb. 2006
A Quantitative Overview to Gene Expression Profiling in Animal Genetics Affymetrix Chips Example Mixed-Model Equations CG: Comparison Group = Expression Intensities from the same chip (15) and flag (3). Hence, 45 Levels. Gene by Animal (5) for Biological Variability Prop. Total Variance: Gene by Stage (3) • ~ 3% of Genes being DE in a given contrast: • Pregnancy – Lactation • Pregnancy – Involution • Lactation – Involution Armidale Animal Breeding Summer Course, UNE, Feb. 2006
A Quantitative Overview to Gene Expression Profiling in Animal Genetics Affymetrix Chips Example Differentially Expressed Genes • A final list of 4,003 DE genes (16.6%) was generated after exploring three statistical approaches: • GS: GeneSpring (t-stat) • MME: Mixed-Model Equations • BCI: Bootstrap Confidence Intervals Armidale Animal Breeding Summer Course, UNE, Feb. 2006
A Quantitative Overview to Gene Expression Profiling in Animal Genetics Affymetrix Chips Example Clustering Differentially Expressed Genes Armidale Animal Breeding Summer Course, UNE, Feb. 2006