Download
1 / 19
190 likes | 288 Views
A Quantitative Overview to Gene Expression Profiling in Animal Genetics. Analysis of (cDNA) Microarray Data : Part V. Mixtures of Distributions Model-Based Clustering via Mixtures of Distribution. Armidale Animal Breeding Summer Course, UNE, Feb. 2006.

E N D
A Quantitative Overview to Gene Expression Profiling in Animal Genetics Analysis of (cDNA) Microarray Data: Part V. Mixtures of Distributions Model-Based Clustering via Mixtures of Distribution Armidale Animal Breeding Summer Course, UNE, Feb. 2006
A Quantitative Overview to Gene Expression Profiling in Animal Genetics Mixtures of Distributions Definition • The mixture model assumes that each cluster (or component) of the data is generated by an underlying normal distribution. • Each of the data in y are assumed to be independent observations from a mixture density with k (possibly unknown but finite) components and with probability density function: Normal density function Mixing proportions (add to 1) Armidale Animal Breeding Summer Course, UNE, Feb. 2006
A Quantitative Overview to Gene Expression Profiling in Animal Genetics Mixtures of Distributions Introduction Armidale Animal Breeding Summer Course, UNE, Feb. 2006
A Quantitative Overview to Gene Expression Profiling in Animal Genetics Mixtures of Distributions http://www.maths.uq.edu.au/~gjm The Guru Armidale Animal Breeding Summer Course, UNE, Feb. 2006
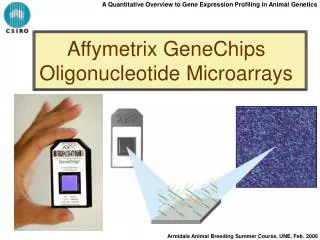
A Quantitative Overview to Gene Expression Profiling in Animal Genetics Mixtures of Distributions Software and Resources Armidale Animal Breeding Summer Course, UNE, Feb. 2006
A Quantitative Overview to Gene Expression Profiling in Animal Genetics Mixtures of Distributions EM Algorithm The EM algorithm obtains the maximum likelihood estimate of by iteration. In the (m+1)th iteration, the estimates of the parameters of interest are updated by: Where Is the Posterior Probability that yj belongs to the i-th component of the mixture (…with a very elegant link to False Discovery Rate). Armidale Animal Breeding Summer Course, UNE, Feb. 2006
A Quantitative Overview to Gene Expression Profiling in Animal Genetics Mixtures of Distributions EM Algorithm • We proceed for k = 1, 2, 3, …, and so on components. • Criteria for model selection includes the Akaike Information Criterion (AIC) and the Bayesian Information Criterion (BIC): Where Is the number of independent parameters in the mixture. • Alternatively, the distribution of the likelihood ratio test (LRT) can be estimated by bootstrapping and P-values obtained to contrast a model with k components against a model with k + 1 components. Armidale Animal Breeding Summer Course, UNE, Feb. 2006
A Quantitative Overview to Gene Expression Profiling in Animal Genetics Mixtures of Distributions Simulation 1 Records 10,000 5,000 Consider these Distribution N(1,5) N(5,10) …and simulate The Mixture becomes: Posterior Prob: Likelihood N(1,5) N(5,10) -1 0.120 0.021 0 0.161 4 0.036 1 0.178 0.056 5 0.036 3 0.126 7 0.005 0.103 6 2 Weighted average (by mixing proportions) Armidale Animal Breeding Summer Course, UNE, Feb. 2006
A Quantitative Overview to Gene Expression Profiling in Animal Genetics Mixtures of Distributions Simulation 2 Records 9,000 1,000 Microarray Non-DE Genes DE Genes Consider these Distribution N(0,1) N(0,10) …and simulate The Mixture becomes: Armidale Animal Breeding Summer Course, UNE, Feb. 2006
A Quantitative Overview to Gene Expression Profiling in Animal Genetics Mixtures of Distributions Simulation 2 1. Simulate: 2. Ask EMMIX to fit mixtures with up to 5 components and… 3. EMMIX model of best fit: Armidale Animal Breeding Summer Course, UNE, Feb. 2006
A Quantitative Overview to Gene Expression Profiling in Animal Genetics Mixtures of Distributions Simulation 2 1. Simulate: 3. EMMIX best fit: Post Prob Frequency Posterior Probabilities are “Decision Function” changing at 2.75 Armidale Animal Breeding Summer Course, UNE, Feb. 2006
A Quantitative Overview to Gene Expression Profiling in Animal Genetics Mixtures of Distributions Linking Posterior Probabilities with False Discovery Rate Armidale Animal Breeding Summer Course, UNE, Feb. 2006
A Quantitative Overview to Gene Expression Profiling in Animal Genetics Mixtures of Distributions Linking Posterior Probabilities with False Discovery Rate Select the N most extreme genes, and FDR is the average posterior probability of not being in the cluster of extremes. DE Not-DE Armidale Animal Breeding Summer Course, UNE, Feb. 2006
A Quantitative Overview to Gene Expression Profiling in Animal Genetics Mixtures of Distributions Simulation 2 1. Simulate: 3. EMMIX best fit: FDR by N Genes Select the N most extreme genes, and FDR is the average Post Prob of not being in the cluster of extremes. Post Prob Armidale Animal Breeding Summer Course, UNE, Feb. 2006
A Quantitative Overview to Gene Expression Profiling in Animal Genetics Mixtures of Distributions Example “Diets” (only REFERENCE components of the design) Armidale Animal Breeding Summer Course, UNE, Feb. 2006
A Quantitative Overview to Gene Expression Profiling in Animal Genetics Mixtures of Distributions Example “Diets” (only REFERENCE components of the design) Armidale Animal Breeding Summer Course, UNE, Feb. 2006
A Quantitative Overview to Gene Expression Profiling in Animal Genetics Mixtures of Distributions Example “Diets” (only REFERENCE components of the design) Armidale Animal Breeding Summer Course, UNE, Feb. 2006
A Quantitative Overview to Gene Expression Profiling in Animal Genetics Mixtures of Distributions “Diets” (only REFERENCE components of the design) Example Armidale Animal Breeding Summer Course, UNE, Feb. 2006
A Quantitative Overview to Gene Expression Profiling in Animal Genetics Mixtures of Distributions “Diets” (only REFERENCE components of the design) Example FDR by N Genes In Reverter et al. ‘03 (JAS 81:1900), 27 genes were reported as having a PP > 0.95 of being in the extreme cluster. Now, we can assess that these 27 genes include a FDR < 10%. Armidale Animal Breeding Summer Course, UNE, Feb. 2006