Download

1 / 27
380 likes | 1.09k Views
Microarray and Gene Expression Profiling. Henry Nguyen Wenjing Tao University of Missouri. Gene expression: transcription. Gene Transcription: DNA → RNA. Gene Translation: RNA → Protein. Expression analysis techniques. Gene expression data is created by process of Microarray

E N D
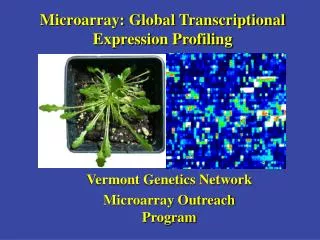
Microarray and Gene Expression Profiling Henry Nguyen Wenjing Tao University of Missouri
Gene expression: transcription Gene Transcription: DNA → RNA Gene Translation: RNA → Protein
Expression analysis techniques • Gene expression data is created by process of • Microarray • RT-PCR • Differential display • cDNA AFLP • SAGE
Application of microarray • DNA microarray, or DNA chips are fabricated by high-speed robotics, generally on glass but sometimes on nylon substrates, for which probes* with known identity are used to determine complementary binding, thus allowing massively parallel gene expression and gene discovery studies (http://www.gene-chips.com/GeneChips.html) • Application: http://www.dnai.org/d/index.html
Microarray: high through-put whole genome approach Each grid contain 650 probes 48 grids, with 31k probes Microarray is a tool for analyzing gene expression that consists of a small membrane or glass slide containing samples of many genes arranged in a regular pattern
Kinds of array features Synthetic oligonucleotides: Affymetrix genechip Long oligo array PCR products from cloned cDNAs or genomic DNAs: cDNA array
cDNA & oligonucleotide arrays 100-300 m spot 20-25 mers Schulze and Downward, 2001 Nat Cell Biol 3, 190
Microarray terminology Feature - an array element Probe - a feature corresponding to a defined sequence (immobilized on a solid surface in an ordered array) Target - a pool of nucleic acids of unknown sequence
Microarray or Chip + Probe: oligos/cDNA (gene templates) Target: cDNA (variables to be detected) Samples Hybridization Analysis of outcome Graphical and numerical exploratory data Data mining: statistical model of computations Classification and discrimination Functional annotation Pathway and pattern analysis Understanding genes implicated in physiological responses (phenotype) Gene Expression Analysis Using Microarrays
Raw data and processed data Raw data-images (treatment Cy5 vs. reference Cy3) • Red (Cy5) dot • overexpressed or up-regulated • Green (Cy3) dot • underexpressed or down-regulated • Yellow dot • equally expressed • Black represents areas where neither the reference nor test DNA hybridized to the target DNA. • Intensity - “absolute” level • Red/green - ratio of expression • 2 - 2x overexpressed • 0.5 - 2x underexpressed • log2( red/green ) - “log ratio” • 1 2x overexpressed • -1 2x underexpressed Long oligo plotted microarray
Microarray experiment standardization • MIAME (Minimum Information About a Microarray Experiment) • Experimental design, • Array design • Samples, hybridisations • Measurements and controls • Databases : data storage and exchange • Public repositories: • GEO (NCBI), GeneX (NCGR), ArrayExpress (EBI) • In-house databases • Proprietary databases – • Gene Logic, NCI, Synergy (NetGenics), Genomics Knowledge Platform (Incyte)
Functional Genomics of Root Growth and Root Signaling under drought
Transcriptome characterization of apical and basal regions of maize root under water deficit conditions Henry Nguyen’s lab University of Missouri
Objectives • To identify genes contributing to root growth maintenance under water deficit condition • To determine genes responsible for progressive inhibition of root elongation under water-deficit condition • To compare the differential gene expression in root region of progressive inhibition of root elongation under water stress with the normal growth deceleration in well-watered root region
Growth Plant roots play a vital role in water and mineral acquisition, and are essential for plant growth and development. Under conditions of drought, roots can adapt to continue growth while at the same time producing and sending early warning signals to shoots, which inhibit plant growth above ground. ROS and stress Redox Cell wall related Phenylpropanoid pathway Drought Stress Cellular protection & adaptation processes Signal transduction & gene expression Signaling: Sensor/recognition Root growth Primary root growth and drought stress
6 4 4 5 4 3 3 3 2 2 2 1 1 1 WS48 WW48 4 3 2 1 WW24 Experimental design - pairwise comparison Sharp et al. 2004, J Exp. Botany 2004
Characteristics of the maize long oligo array • Maize oligo array was printed at University of Arizona as a slide pair • 57,452 70-mer oligos were designed and synthesized by Qiagen/Operon • These oligos represent five diverse sequence groups: • TIGR Maize Gene Index (26,000 TCs, 20,500 singletons) • TIGR Maize Genome Sequencing Project (9700 AZMs, 80% of AZMs are transcriptomes) • Organelles (460 oligos based on chloroplast and mitochondria sequences) • Non redundant repetitive elements (total 800 oligos, 400 oligos in both orientations) • Favorite genes from maize research community (300)
WS/WW=Cy3/Cy5 WS/WW=Cy5/Cy3 Dye Swap Array experiments WW48 region 1 vs. WS48 region1 Technical replicates: dye swap CF024887 BM379776
Two-color microarray data feature 1. Channel A intensity vs. channel B intensity 2. Log channel A intensity vs. log channel B intensity 3. R-I 5. Box plot 4. Z-score histogram
Computation & Analysis • Statistical analysis: mixed linear ANOVA model (F test) with Benjamini and Hochberg false discovery rate (FDR) multiple testing correction • Real-time PCR verification of microarray data • Gene annotation, functional category, and pathway analysis
Real time PCR • Traditional PCR: use agarose gels for detection of PCR amplification at the final phase or end-point of the PCR reaction, results are based on size discrimination. • Real-Time PCR: use small amounts of template, measuring the kinetics of the reaction in the early phases of PCR, detect the accumulation of amplicon during the reaction, measure standard curve and calculate template copy number
Gene ontology analysis to categorize significant differentially expressed genes in maize root region 1
Transcription factors and regulatory elements in the promoters of genes in the stress response Root region 1: • 97 stress related TFs • 160 genes with these TFs’ response elements. Some of these are with multiple responsive elements • Gene regulation networks based on transcription factors and their regulation targets are being studied using real-time PCR in root tissues over a time course • Root region 2 and region2-3: • These TFs and their regulation targets are also being detected in root region 2 and region2-3 data sets.
References • Plant Root Genomics Consortium • http://rootgenomics.missouri.edu/prgc/index.html • BASE • http://bioinf2.rnet.missouri.edu/