Download
1 / 24
270 likes | 535 Views
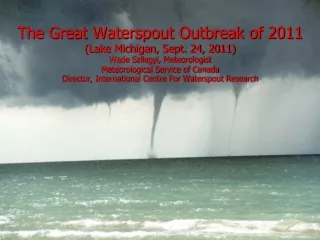
A New Great Lakes Waterspout Prognostic System (Automation of the Waterspout Nomogram ) Wade Szilagyi and Victor Chung Presented by: David Rodgers Meteorological Service of Canada 20 th U.S. – Canadian Great Lakes Operational Meteorology Workshop March 14-16 th 2012. Introduction.

E N D
A New Great Lakes Waterspout Prognostic System (Automation of the Waterspout Nomogram) Wade Szilagyi and Victor Chung Presented by: David Rodgers Meteorological Service of Canada 20th U.S. – Canadian Great Lakes Operational Meteorology Workshop March 14-16th 2012
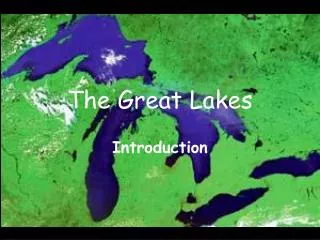
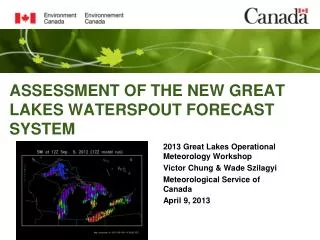
Introduction Purpose • To develop an algorithm that produces a waterspout prognostic field for the Great Lakes Advantages • Dramatically reduces diagnosis time • More efficient coordination between forecast offices • Precursor upstream forecast events viewable
Development History • 1994 – Intensive investigation initiated into waterspout activity over the Great Lakes • 1996 – Waterspout Nomogram • 2004 – Szilagyi Waterspout Index • 2011 – Experimental Waterspout Prognostic System
Waterspout Nomogram • An empirical technique to forecast waterspouts • Based on 207 events over the Great Lakes from 1988 to 2011 • Predictors: • Water-850 mb temperature difference (ΔT) • Convective cloud depth (EL-LCL = ΔZ) • 850 mb wind speed (W850 )
Szilagyi Waterspout Index (SWI) • Quantifies the likelihood of waterspout formation • A set of dimensionless SWI values (from -10 to +10) are plotted on the Waterspout Nomogram • Waterspouts are likely to occur when SWI ≥ 0. The larger the SWI the greater the potential • SWI is a function of both ΔT and ΔZ
A New Waterspout Prognostic SystemDevelopment based on the SWI
An Overview of the Waterspout Algorithm CMC GemReg Output OR CMC GemLam Output Gridded Water Temp Surface data Upper Air data Sounding Profile (at every grid) Central Command Program PGSM [CMC] Sort NinJo Parcel trajectory (parameters required for the index) Output display SWI output fields SWI lookup table (derived from nomogram) Web Output display
Conversion of Nomogram to SWI • Each (ΔT,ΔZ) pair has an associated SWI value SWI Lookup Table ΔT Cloud Depth (ΔZ) SWI . . -1 54000 55000 8.5 -1 55000 56000 9 -1 56000 57000 9.5 -1 57000 58000 10 . . 0 3000 4000 -8.5 0 4000 5000 -8 0 5000 6000 -7.5 0 6000 7000 -7 . . 1 9000 10000 -6 1 10000 11000 -5.5 1 11000 12000 -5.5 . . 6 33000 34000 3.5 6 35000 36000 4.5 6 36000 37000 5 6 38000 39000 6 . . Conversion of nomogram to SWI through a lookup table
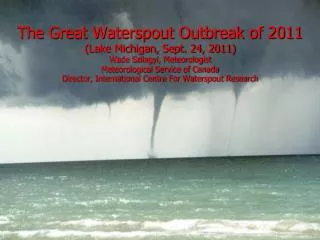
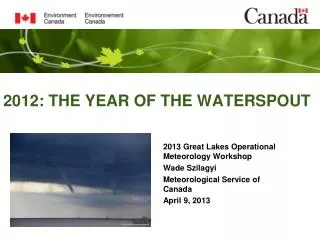
Two Cases • August 21, 2011 – The Goderich Tornado Event • September 24, 2011 – The Lake Michigan Outbreak
Case 1 August 21, 2011 – The Goderich Tornado Event
GEMREG Model Output for 12Z Aug 21 and 00Z Aug 22, 2011 500 mb Height / Vorticity 12Z, Aug 21, 2011 500 mb Height / Vorticity 00Z, Aug 22, 2011
Upstream signals for Goderich waterspout. Also, a waterspout spotted 2.5 km off shore from Massassauga Provincial Park at ~1645Z Waterspout Index at 15Z Aug 21, 2011 SWI Color Scale 1645Z: 1 waterspout 2.5 km off of Massassauga Provincial Park Upstream signals for Goderich waterspout
Hook Echo evident from 1930-1955Z northwest of Goderich Waterspout Index at 18Z, Aug 21, 2011 SWI worked very well for this event. http://www.ctv.ca/gallery/html/goderich-tornado/index_.html
Hook echo was evident at 1950 and 2000Z as the storm cell moved onshore
Cold air advection behind front increasing area of waterspout potential Waterspout Index at 21Z, Aug 21, 2011
Cold air continues to advect south area of waterspout potential more extensive Waterspout Index at 00Z, Aug 22, 2011
Case 2 September 24, 2011 – Waterspout outbreak over Lake Michigan
Upper Low near Chicago, 12Z September 24 Waterspout Index at 12Z, Sept 24, 2011 1430-1545Z: 4 waterspouts off Fort Sheridan 1200Z: 1 waterspout 2 miles east of Waukegan 1200Z: 4+ waterspouts distant east of LI pier in Chicago 1445-1520Z: 1 waterspout 3-4 miles east of Chicago
18Z September 24 Waterspout Index at 18Z, Sept 24, 2011 1510-1545Z: 7 waterspouts off of Milwaukee 1625Z: 1 waterspout 2 miles northeast of Chicago
21Z September 24 Waterspout Index at 21Z, Sept 24, 2011 2015Z: 1 waterspout 1 mile southeast Kenosha
00Z September 25 Waterspout Index at 00Z, Sept 25, 2011 0010Z: 1 waterspout 2 miles east of Kenosha
Conclusion • The new waterspout prognostic system speeds up the process for diagnosing waterspout potential • The applicability of the algorithm has been demonstrated positively through a number of case studies • The Goderich case showed that the SWI field could be used as a precursor signal of tornados downstream
Future • Adopt a higher resolution grid (0.1 lat x 0.125 long) and use GemLam • Distinguish between “tornadic” vs “non-tornadic” waterspouts • Include surface convergent fields (GemReg/GemLam) Refine risk area • Automated output 24/7 • Expand to other marine areas: Atlantic/Pacific coasts, globally • Relate SWI to landspouts