Download
1 / 62
620 likes | 807 Views
Perception. Kurt Akeley CS248 Lecture 18 29 November 2007 http://graphics.stanford.edu/courses/cs248-07/. Today. This is the last for-credit lecture Material from next-weeks lectures will not be tested Emphasize perception Pull together and re-emphasize ideas from earlier lectures

E N D
Perception Kurt Akeley CS248 Lecture 18 29 November 2007 http://graphics.stanford.edu/courses/cs248-07/
Today • This is the last for-credit lecture • Material from next-weeks lectures will not be tested • Emphasize perception • Pull together and re-emphasize ideas from earlier lectures • Introduce some new ideas • Tie everything back to performance
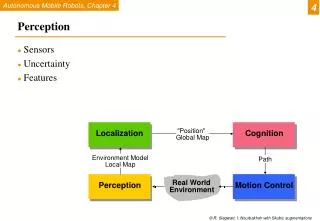
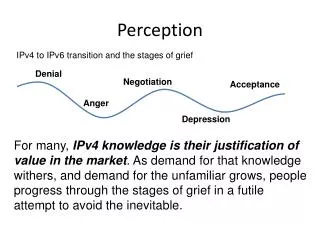
What is the image of this (ideal) line? Optical quality of the eye • Range of focus: • 5” to infinity (you) • 40” to infinity (me, corrected) Fovea Image from www.wikipedia.com
Retinal image of an ideal line Eye image from www.wikipedia.com
Retinal image of a sine wave grating Lower contrast Eye image from www.wikipedia.com
Ricco’s Law • Area and intensity are indistinguishable for objects that subtend less than (roughly) 6 arc min. • This allows antialiasing to work • Especially fractional-width points and lines • Antialiased pixels should subtend less than 6 arc min
Spatial resolution of the eye • Cone spacing in the fovea: • L and M cones: 0.5 arc min • S cones: 10 arc min • Nyquist frequency for foveal photopic vision is 60 cpd • Half the 120 cone/deg density • Nyquist frequency is much lower outside the fovea • Effective receptor density falls to 1/20th that of the fovea ? • Rendering can take advantage of this • E.g., insets in flight-simulation graphics accelerators Thus the lower spectral response seen in the color theory lecture
No aliasing in foveal vision Peripheral Nyquist frequency (approximate) Foveal Nyquist frequency
No aliasing in foveal S cones either • Optics of the eye are substantially worse for 400 nm light • MTF did not show this (it is an aggregate)
Vernier acuity • Can detect an offset of 5 arc sec • But sensor spacing is 30 arc sec • How does this work? • Not due to random sensor locations (works with very short lines) 5 arc sec
How vernier acuity (probably) works Cone spacing
Display resolution θ d h Satisfies Ricco’s Law (less than 6 arc min)
Matching foveal resolution Foveal resolution
Flicker • Flicker fusion threshold • Statistically 16 Hz • Increases • In peripheral vision • With brighter scenes • With viewer fatigue • Flicker rates: • Movies: 48 Hz (typical), 72 Hz (using computer displays) • Video: 60 Hz (US NTSC), 50 Hz (Europe and Asia, PAL) • Computer displays: 60-100 Hz (CRT), no flicker (LCD) • Fluorescent lights: 120 Hz (US), 100 Hz (Europe, Asia) Hence “jumping” numeric or CRT displays, when you aren’t looking directly at them
Frame rate vs. flicker rate • Increasing flicker rate above frame rate: • Avoids flicker-rate problems • But introduces visual artifacts • Image doubling (2x) or even tripling (3x)
Interlaced displays • Two fields per “frame” • Display odd lines in the first field • Display even lines in the second field • “Frame” is misleading: • True interlaced sampling is “flying spot” • Each pixel is sampled and displayed at proportional times • Motion artifacts are avoided • Interlaced frames (e.g., video display of a movie) • All pixels are sampled at the same moment • But display is sequential, causing motion artifacts • Still common in video • 1080i is standard • 1080p is becoming more common Big battle during definition of HDTV!
Field n Field n+1 Field n+2 Interlacing and antialiasing • Small moving objects can disappear • Object subtends a single pixel • Fields are rendered properly (not from a single frame) • One solution is antilaliasing with a large filter kernel • Rendered objects necessarily subtend more than a single pixel
Color sequential displays • Time-sequential red, green, blue (and sometimes white) • Examples: • Many digital projectors • Professional head-mounted displays • Should render each “frame” separately • Movies don’t • So time sequential projectors yield “rainbow” effects • Simulation systems do • So motion artifacts are avoided
Mach banding – slope discontinuities Same peak intensities
Human response is not linear • Twice as many photons/sec does not appear twice as bright • Instead 5.7 times as many photons appear twice as bright • Brightness (human perception) and intensity (actual photon rate) are related by Steven’s Power Law:
Human sensitivity is not linear either • Can distinguish intensity differences of 1% • Static images • Photopic (intensities bright enough for cones to see) • This corresponds to a linear change in brightness
Numeric representation • Optimal numeric representation would arrange for adjacent intensities to be (barely) indistinguishable. • Thus optimal numeric representation is • nonlinear in intensity (relative differences of 1 percent) • but linear in brightness (absolute differences of k(0.01)0.4)
Contrast ratio • Visible contrast: • 4-5 orders of magnitude within a scene (at the same time) • 6 orders of magnitude of “adaptation” • Can take up to 40 minutes, though
Solutions • Brightness-linear storage • Use linear arithmetic (get incorrect answers) • Use non-linear arithmetic (get correct answers) • Convert convert to intensity-linear, operate, convert back • Implement nonlinear arithmetic • Intensity-linear storage • Gamma correct (convert to brightness-linear form) when displaying
Brightness-linear storage Intensities can be added, brightnesses cannot Store image linear in brightness (unusual in 3-D systems) Best use of available storage precision 256 representable levels are enough Requires conversion for each pixel operation (e.g., blend) n 8 8-bitframebuffer Gammaconverter Display DAC 8
Intensity-linear storage Store image linear in intensity (typical in 3-D systems) Native arithmetic format Requires conversion during display Large brightness steps at low intensities 256 DAC levels is OK, but frame buffer needs more n n n-bitframebuffer Gammaconverter Display DAC 8
What is n ? Assume 8-bit DAC Gamma of 2.4 …
Display gamut No finite set of primaries can reproduce the entire gamut. But more primaries do a better job.
Perception and Performance (adapted from my VR2004 keynote)
Latency • For an out-the-window display • 100 to 150 milliseconds • For a head-mounted display • 5 to 15 milliseconds** • Total response latency, sum of • Tracking/input delay, plus • Rendering delay, plus • Display delay • A 72 Hz display refreshes every 14 ms ** source: Fred Brooks
Latency solution • Reduce system latency to 5-15 ms range • Requires 2-4 ms frame time (250-500 Hz) • Assuming 3-frame latency • Estimated cost: 5x
Stereo solution • Binocular disparity is a very strong visual cue • Must render separately for each eye • Occlusion • View-dependent lighting (e.g. reflections, specularity) • Alternatives tend to be hacks • Estimated cost: 2x
Incorrect retinal cue – blur gradient Correct Incorrect
f Focus cue solution • Multiple image plane display • Fixed relationship to viewer (e.g. head mounted) • Low resolution in depth • Non-occluding images with depth filtering • Separate left and right displays (2x cost already accounted) • Leverages 2D technology • Amounts to a 2.5D display • Cost estimate: 3x
High Dynamic Range (HDR) Numbers from Sunnybrook Technologies • Human limitations • 1,000,000:1 range of sensitivity • 100,000:1 contrast within scene • Current displays • CRT 300:1 contrast ratio • LCD 1000:1 contrast ratio • SIGGRAPH 2003 ET • Sunnybrook Technologies
Sunnybrook Technologies • Dual-density display • Conventional LCD panel in front (full-resolution) • White LED array used as back-light (~1/50 resolution)
Sunnybrook Technologies • Scattering masks low resolution LEDs
HDR solution • Requires 16-bit framebuffer components • Rendering • Blending • Full-scene anti-aliasing • Requires multi-resolution rendering • Full-resolution for LCD, corrected for back-lighting • Low-resolution for back-lighting • Estimated cost: 2x
Field of view • Human field of view (FOV) • Monocular: 160 deg (wide) x 135 deg (high) • Binocular: 200 deg (wide) • Binocular overlap: 120 deg (wide) • Typical screen FOV • 55 deg (wide) x 41 deg (high) d d
Optical flow matters “Women Go With the (Optical) Flow”, Desney S. Tan, Mary Czerwinski, George Robertson. http://research.microsoft.com/users/marycz/chi2003flow.pdf
FOV solution • Double horizontal FOV to 110 degrees • Double vertical FOV to 80 degrees • Cleverness to distribute resolution ? • e.g. cylindrical projection • Estimated cost: 5x
Pixels subtend different angles • Assumes planar display Center pixel Edge Pixel Field of view