Download
1 / 27
270 likes | 384 Views
Development Targets and Costs. Based on paper by Luc Christiaensen Christopher Scott Quentin Wodon. Outline . Current practice The political economy of target setting Approaches to target setting Historical benchmarking; Macro-simulations; Micro-simulations

E N D
Development Targets and Costs Based on paper by Luc Christiaensen Christopher Scott Quentin Wodon
Outline • Current practice • The political economy of target setting • Approaches to target setting Historical benchmarking; Macro-simulations; Micro-simulations • Approaches to cost estimation Average costs and efficiency • Concluding remarks
1. Are current targets realistic? • A target is a value which a specific indicator should attain by a particular date • Current practice • Honduras: cost of reaching PRSP targets and IDG goals together with anticipated wage increase for public employees is high vs HIPC debt relief • Guinea: • Goal: 10 % annual agricultural growth rate by 2010; • Only 5 % of the 3921 recorded 3-year moving averages of ag growth in all countries worldwide over past 4 decades exceeded 10 % growth rate • Cambodia: • Goal: reduce child undernutrition by 15 % points from 1998 to 2000; • requires annual GDP/cap growth rate of 31 % (2005 as end date)
2. Political economy of target setting • Targets provide incentives a) Resource mobilization • targets must be realistic b) Resource allocation and consensus building broad societal support and iterative process required proliferation of targets erodes their effectiveness
Political economy of target setting, cont. 2 c) Performance evaluation: targets introduce accountability • Targets must be attainable and carry broad societal support • Poor performance by implementing actors must be distinguishable from the effects of external shocks • Failure to meet targets must entail consequences for the actors While targets have in principle positive incentive effects, these do not follow automatically
Political economy of target setting, cont. 3 • Experience from Britain • When the Government set local authorities a target for collecting recyclable waste, it seemed a good idea. Even better, the local authorities persuaded residents to take the trouble to separate the stuff that was worth recycling from all the rest--and met their target. There was only one snag. The target was for collecting recyclable waste, not for recycling it. As a result, some local authorities put the rubbish that had been so carefully separated back in with the rest of their garbage, and incinerated the lot. Targets must be SMART: Specific, Measurable, Achievable, Relevant and Time-bound
Selected choices in target setting • Targets for inputs, outputs, or for outcomes and impacts? • Focus on outcome and impact targets, though input and output targets possible for short run • Check for vertical and horizontal consistency (Uganda) • Caution against proliferation of targets • Point targets or target ranges? • Given uncertainty surrounding input/output relations: • target ranges for outcomes/impacts • target points for inputs/outputs
Selected choices in target setting, cont. 2 • Aggregate or disaggregate targets? • Equity versus efficiency • But: perverse incentives and proliferation of targets • Short-run or long-run targets? • Decision rule: marginal cost of, say, poverty reduction equated across time periods • In practice: thought needs to be given to appropriate time path for achieving the target, depending on state of country
3. Approaches to target setting • To facilitate resource allocation and to foster accountability it is key that targets are realistic: they must be technically and fiscally attainable • Three methods to gauge technical feasibility • Historical benchmarking • Macro-simulations • Micro-simulations
3.1 Historical benchmarking • Historical evidence and international comparison • Neither time nor skill intensive and data readily available hence, this is a minimum requirement • Agricultural growth in Guinea and neighboring countries 1970-2000
3.2 Macro-simulations • Gauge feasibility of poverty and social development targets by feasibility of implicit economic growth requirements • Two methods to set targets for poverty • Growth required to reduce poverty by a certain percentage, assuming no change in income distribution • Estimated net elasticity to growth
Macro-simulations, continued • Estimated elasticity of social indicators to GDP/cap growth controlling for time trends and urbanization ; (elasticities can be estimated with world wide panel data (splines, 5 intervals) for GDP/cap and urbanization) • Exemples: • Demery and Walton (1999) use an elasticity of under 5 child mortality to GDP/cap growth of –0.4 (SimSIP elasticity varies between zero and –0.47) • Alderman et al. (2000) estimate an elasticity of prevalence of child malnutrition to GDP/cap growth of - 0.09 (SimSIP elasticity between zero and –1.1)
Macro-simulations, continued • Other intervening factors may be important results of growth based simulations indicative only • Some tools arguably more sophisticated though also more data and skill intensive; yet literature now exists • Must be used with caution as results are not indicative of policy actions needed
3.3 Micro-simulations • Country-specific nature of relationship between development outcomes and their determinants lost in macro approach regression analysis and micro-simulations based on household data • Application to child malnutrition in Ethiopia: • 15 years of 2.5 % growth of income/adult equivalent and bringing at least one female adult/household up to level of primary school level reduce prevalence of child stunting by 9 to 29 percent, far removed from international goal of halving child stunting by 2015 • If combined with nutrition education programs reduction by up to 42 % • Increasingly possible, as more and more household data sets are becoming available, yet technically difficult
4. The cost of reaching a target • Targets must be technically AND fiscally attainable • Effect of (public and private) expenditures on development outcomes depends on: • amount spent on these objectives • effectiveness of money spent • Fiscal sustainability of targets can be gauged by • Government’s capacity for increasing public spending • Government’s scope for enhancing efficiency of its spending
4.1 Costs and fiscal sustainability • Need for detailed sectoral information • SimSIP simulator for estimating costs of reaching education targets • Education example: average costing method • Need for assumptions on: • Demographics: number of children of various age groups joining education system
Costs and fiscal sustainability, cont.2 Data on • Cost parameters: • Supply-side costs: teacher wage, teacher-student ratio, administrative costs • Demand side costs: stipend value, coverage • Investment costs: cost per classroom, teacher training • Delivery system: • length of schooling cycle, repetition, promotion, and drop out rates by cycle or by grade, distribution of age at entry for each cycle Targets for • Changes in distribution of age at entry • Changes in repetition, promotion and drop out rates
Costs and fiscal sustainability, cont.3 • Logic of education costing • Detailed cohort analysis depending on efficiency parameters (promotion, repetition, drop out, …) • Parametrize software to reproduce initial conditions • budget spending by cyle • teacher salaries, share of administrative budget • number of children enrolled by cycle • net & gross enrollment rates, with targets • realistic other parameters (cost of new schools/classrooms) • Change efficiency parameters and demographics over time, and track various costs as they evolve • Number students number teachers/classrooms costs
Costs and fiscal sustainability, cont.3 • Selected parameters for Liberia – primary level (all parameters must be checked) • Net enrollment (CWIQ 2007): 37.3% (low probably due to conflict – older children enrolling in last few years) • Gross enrollment (CWIQ 2007): 86.3% • Budget: +/- US$ 4 million • Number of teachers: 26,755 cost/teacher • Number of students: 894,316 pupil/teacher ratio 33 • Share of public sector: 67% (incl. community) • New entrants every year: +/-110,000, to increase in future • Admin cost: 15% (assumption)
Costs and fiscal sustainability, cont.3 • Selected parameters for Liberia – secondary level (all parameters must be checked) • Net enrollment (CWIQ 2007): 15.2% (low probably due to conflict – older children enrolling in last few years) • Gross enrollment (CWIQ 2007): 51.3% • Budget: +/- US$ 1.5 million (need to check) • Number of teachers: 8756 cost/teacher • Number of students: 150,914 pupil/teacher ratio 17 • Share of public sector: 46% (incl. community) • New entrants: depends on primary schooling parameters • Admin costs: 15% (assumption)
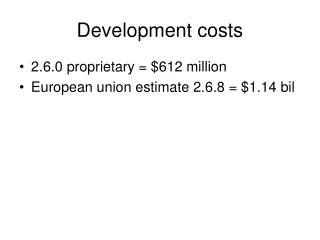
Example of simulation (VERY prelim.) Note: 2003 in simulator represents 2006 in reality; Assumes no increases in real wage for teachers; Secondary spending expected to increase faster; Possibility to estimate needed investment costs; overall costs probably underestimated/need to get correct data
4.2 Efficiency considerations • Outcomes can be increased through • Expansion of inputs keeping efficiency constant • Increase in efficiency keeping inputs constant • Given limited tax base, room for expansion of social expenditures often narrow • Murray et al. (1994): typical country in Sub Saharan Africa could improve health outcomes by 40 % simply by reallocating resources to most cost-effective intervention mix
Measuring efficiency Best performance frontier b E=a/(a+b) o a
Measuring efficiency, examples • Efficiency of national health systems (WHO) • Output: disability adjusted life expectancy Inputs: real total (private and public) health expenditures/capita and average years of schooling • E>0.7 (good): Costa Rica, Sri Lanka, Bangladesh (good) 0.7<E<0.5 (mediocre): Gambia, Viet Nam E<0.5 (poor): most African countries, e.g. E for Guinea and Kenya respectively 0.47 and 0.32
Concluding remarks & discussion points • In principle, targets powerful tools to foster accountability and facilitate consensus building; • Targets must be carefully designed and evaluated; they must be SMART • Chapter focused on feasibility aspect, though also need for more hard rules on other aspects of target design
Remarks & discussion points, cont. 2 • Set of readily applicable tools to assess technical and fiscal feasibility of development targets • Each tool has its limitation need for joint application • Tools must be used with care; they are indicative of feasibility of targets, but not of policies needed • Tools only useful in practice if readily available • Need for continuous updating of elasticities = public good • Encourage policy simulations based on household data • Research on efficiency of expenditures on social outcomes