Download
1 / 24
240 likes | 332 Views
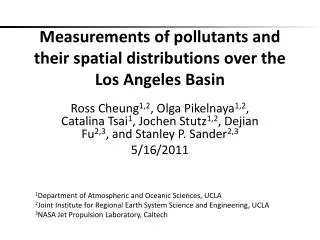
Remote Sensing of Spatial Distributions of Greenhouse Gases in the Los Angles Basin. Dejian Fu 1,2 , Thomas J. Pongetti 1 , Stanley P. Sander 1,2 1 NASA Jet Propulsion Laboratory, California Institute of Technology, Pasadena, CA 91109, USA

E N D
Remote Sensing of Spatial Distributions of Greenhouse Gases in the Los Angles Basin Dejian Fu1,2, Thomas J. Pongetti1, Stanley P. Sander1,2 1NASA Jet Propulsion Laboratory, California Institute of Technology, Pasadena, CA 91109, USA Ross Cheung2,3, Jochen Stutz2,3,ChangHyoun Park2,3, Qinbin Li2,3 2UCLA Joint Institute for Regional Earth System Science and Engineering, University of California, Los Angeles, CA 90095, USA 3Department of Atmospheric and Oceanic Sciences, University of California, Los Angeles, CA 90095, USA
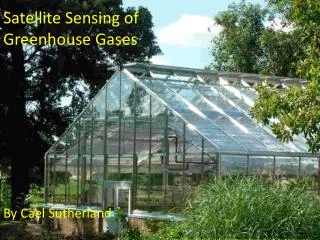
Introduction • The Los Angeles air basin is a significant anthropogenic source of greenhouse gases and pollutants including CO2, CH4, N2O, and CO, contributing significantly to regional and global climate change. • Recent legislation in California, the California Global Warming Solutions Act (AB32), established a statewide cap for greenhouse gas emissions for 2020 based on 1990 emissions. • Verifying the effectiveness of regional greenhouse gas emissions controls requires high-precision, regional-scale measurement methods combined with models that capture the principal anthropogenic and biogenic sources and sinks. • We present a novel approach for monitoring the spatial distributions of greenhouse gases in the Los Angeles basin using high resolution remote sensing spectroscopy. • We participated in the CalNex 2010 campaign to provide greenhouse gas distributions for comparison between top-down and bottom-up emission estimates.
California Laboratory for Atmospheric Remote Sensing (CLARS) at Mt. Wilson Long: 118.057°W Lat: 34.221°N Alt: 1.7 km Surface Reflection (Elevation Scan) Azimuthal Scan Direct Beam (diffuse reflection from Spectralon plate) Pointing Mirror • Spectral range • 4000 – 14000 cm-1 • Species • CO2, CH4, N2O, CO, H2O, HDO • Maximum spectral resolution • 0.02 cm-1 16” Cassegrain Telescope (removable) FTIR Spectrometer (0.7-2.5 m)
Reflection Points Selected for CLARS-FTS • about 2 hours/cycle • 4 – 5 cycles/day • ~ 100 m Spatial Resolution CO2 in-Situ PI: Prof. Sally Newman
Viewing Geometry of CLARS FTS CLARS Site Direct solar viewing Sun In-situ CO2 aircraft In-situ CO2 ground PBL height Reflection Point LA surface • CLARS FTS measures slant column densities (in molecules/cm2) of greenhouse gases along light path • The light path transverses through the boundary layer twice • Distant reflection points have a much longer path though the boundary layer than the nearby points • Simultaneous measurements of O2 column abundance and surface pressure contains the light path at each reflection point
Measurements Using CLARS FTS • Measurements made on 31 days during CalNex ( in blue) • No measurements available when cloudy because CLARS FTS needs solar light as light source • Measurements for long term record are continuing
Sample CLARS FTS GHG Spectra Reflectance from Land Surface CO2 1.6 mm CH4 1.7 mm N2O 2.3 mm O2 1.3 mm
Measurement Precisions • XGAS = 0.2095x[Slant Column Density of GHG] /[ Slant Column Density of O2] • Random error includes only the precision of the fitted spectra. • Systematic error sources: • errors in spectroscopic parameters • higher-order uncertainties in optical path due to aerosols • (O2 measurement corrects first-order scattering effects)
XCO2:XGAS Correlation on May 29th, 2010 • XGAS = 0.2095x[GHG] /[O2] • Ideal weather condition • Near full day coverage • XGAS for all targets on the pointing list are included
XCO2 Distribution over LA Air Basin on May 29th, 2010 8:35 AM
XCO2 Distribution over LA Air Basin on May 29th, 2010 11:16 AM
XCO2 Distribution over LA Air Basin on May 29th, 2010 1:35 PM
XCO2 Distribution over LA Air Basin on May 29th, 2010 3:45 PM
CO2 Measurements From NOAA WP3 Flight During CalNex 2010 use 300 to 500 ppm • 8 days over LA basin • NOAA Picarro and Harvard University QCLS • Picarro measurements are shown in figure • Blue line: individual measurement • Green line: averaged values
CO2 Measured by Picarro on NOAA P3 Plane During CalNex 2010 May 30th, 2010 NOAA Picarro High CO2 VMR
Validation Method • Challenges when compare in situ measurements to CLARS FTS measurements directly • Spatial differences (vertical and horizontal directions) • Temporal differences • Possible solution • Use in situ measurements to validate simulations of WRF-VPRM and WRF-CHEM models • The status and results of modeling work will be present by Dr. ChangHyoun Park et al. (Poster #20) on Wednesday afternoon • Use simulations of WRF-VPRM and WRF-CHEM models to validate CLARS FTS • Integrate slant column density within those model grid boxes along CLARS FTS viewing direction • Compare to the CLARS FTS measurements
Integration Slant Column Density in Each Grid Box of Model - Ongoing • Ray tracing program • Based on Smits' algorithm • Journal of Graphics Tools, 3(2):1–14, 1998 • Input • Coordinates of origin [lat, long, alt] • Incident angle of sun light to grid box • Coordinates of grid box boundary • Output • light travel distance inside grid box • coordinates of outlet point • Compute the slant column density within each grid box • GHG SC (molecules/cm2) = GHG(molecules/cm3) x light path (cm)
Summary and Future Work for CLARS FTS • During CalNex campaign (May 14th to June 20th, 2010), CLARS FTS made measurements on 31 days (out of 38 days). • Measurements are continuing after CalNex campaign for long term record. • XCO2, XCH4, XCO, XN2O are are computed using measured column densities. The XGAS show correlations that will be used to determine the emission rates of GHG. • Validation/improvement of retrieval method using correlative data (ground-based and aircraft) are ongoing. • The WRF-VPRM and WRF-CHEM models for Los Angeles are being developed by the group of Qinbin Li at UCLA. The model will directly assimilate GHG and CO slant columns to derive top-down emissions (poster P20 by Dr. ChangHyoun Park et al. on Wednesday afternoon)
Acknowledgements • Drs. Geoffrey C. Toon and Jean-Francois Blavier at JPL • NOAA • California Air Resources Board • NASA • UCLA JIFRESSE • Your Attention Los Angeles Air Basin December 31st, 2009
Estimation of Measurement Uncertainty • Optimal Estimation Formulism [Rodgers 2000] • S = (KT Se-1 K + Sa-1)-1 • Where • S is a n by n covariance matrix • K is a n by m Jacobian matrix • Se is a m by m covariance matrix of measurement noise • Sa is a n by n covariance matrix of a priori uncertainty • n is the number of parameters contributing to measurement uncertainty • m is the number of spectral data points
CLARS FTS Data Processing Program V1.0 CLARS FTS Interferogram Spectra GFIT P, T [Trace Gas] Measurement Geometry Slant Column Densities along light path of CO2, CH4, N2O, CO, O2 • XGAS Map • XGAS Correlation • XGAS Emission Rate • XGAS Flux
CO2 Measurements From NOAA WP3 Flight on May 30th, 2010 May 30th, 2010