Download
1 / 13
130 likes | 236 Views
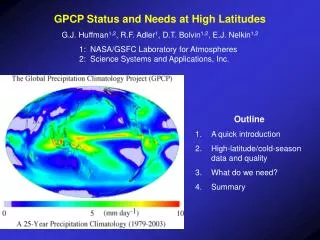
Near-Term Prospects for Improving Quantitative Precipitation Estimates at High Latitudes G.J. Huffman 1,2 , R.F. Adler 1 , D.T. Bolvin 1,2 , E.J. Nelkin 1,2 1: NASA/GSFC Laboratory for Atmospheres 2: Science Systems and Applications, Inc. Outline 1. The Problem 2. Prior Work

E N D
Near-Term Prospects for Improving Quantitative Precipitation Estimates at High Latitudes G.J. Huffman1,2, R.F. Adler1, D.T. Bolvin1,2, E.J. Nelkin1,2 1: NASA/GSFC Laboratory for Atmospheres 2: Science Systems and Applications, Inc. Outline 1. The Problem 2. Prior Work Instantaneous Rates 4. Next Steps 5. Summary
1. THE PROBLEM Retrievals are more challenging at high latitudes - Different T, RH profiles; sfc. T; tropopause and melting levels - Generally light precipitation - Frozen/icy surface knocks out scattering channels Validation is also more challenging - Gauges are sparse - Gauge undercatch more severe - Radar has difficulties with snow and bright band
2. PRIOR WORK Best solution involves high-frequency microwave channels - Try to slice atmospheric signal away from difficult surface issues Some approximate alternatives already exist that can - Provide answers relatively quickly - Fill inter-swath gaps in the high-frequency estimates when they arrive - Stand in for high-frequency estimates where they falter - Provide a multi-decadal record One alternative is to work with OLR Precipitation Index (OPI) - Xie and Arkin (1998) showed that deviations in OLR from local climatology are related to deviations in precip from local climatology - GPCP uses this OPI in the pre-SSM/I period at high latitudes - It is available in monthly and pentad files; we have not pursued it at the instantaneous level due to the higher information content used in the next product
2. PRIOR WORK (cont.) The alternative we chose is working with satellite soundings - Susskind et al. (1997) developed a calibrated cloud volume proxy from TOVS Precip = revised cloud depth * cloud fraction * ƒ ( latitude, season ) - The calibration is TOVS swath data vs. daily FGGE station precip data - Results show low precip rates, very high fractional occurrence • done as a regression • uses instantaneous data as a proxy for daily data • has only one sample for the day cloud top ht. – ( scaled RH + scaled cloud fraction ) 0 = sat. sfc500 mb 9 = dry “ 0 = overcast 4.5 = clear
GPCP V.1 (mm/d) 1988-99 GPCP V.2 (mm/d) 1988-99 2. PRIOR WORK – GPCP Monthly SG Version 1 deficiencies - Data voids at high lat. - Low values in high-lat. ocean Susskind et al. (1997) TOVS adapted for use in Version 2 - Recalibrated to SSM/I at mid-lat., gauge at high lat. The accuracy of interannual fluctuations at high lat. is not yet resolved TOVS algorithm currently applied to AIRS (beginning May 2005)
2. PRIOR WORK – GPCP One-Degree Daily SG experience encouraged us to use TOVS at high lat. in 1DD - By month, at 40°N and 40°S separately, compute rate and occurrence adjustment to daily TOVS to match low-latitude results (from Threshold Matched Precipitation Index), and apply in the appropriate hemisphere 40°-pole - Very appealing results; minimal data boundaries TOVS algorithm currently applied to AIRS (beginning May 2005)
2. PRIOR WORK – GPCP One-Degree Daily (cont.) Daily averages over the Baltic Sea basin show good skill - Bias is related to gauge adjustment from monthly product - Day-to-day events entirely driven by TOVS (in parallel to IR in the band 40°N-S) Figure courtesy of B. Rudolf, DWD/GPCC
AMSR-E AIRS A B A CloudSat C C B A Reflectivity Low High B C 3. INSTANTANEOUS RATES How best to develop an instantaneous sounding-based scheme? As we got serious, the A-Train showed up! - CloudSat provides a “curtain” of cloud/ precip data at all latitudes - AMSR-E provides 2D maps of precip - Here, sfc-based CloudSat echo corresponds to AMSR-E rain area - CloudSat echo based above the sfc shows up in AIRS, but not AMSR-E
AMSR-E AIRS Cal. AIRS 0416-0505 UTC 19 January 2004 3. INSTANTANEOUS RATES (cont.) As a first step, we calibrated Susskind et al. (1997) AIRS to AMSR-E for Jan. 2004 - Compare AIRS, AMSR-E, calibrated AIRS for one descending node - Qualitative agreement
16 January 2004 mm/d 16 January 2004 mm/d 3. INSTANTANEOUS RATES (cont.) Example of AIRS filling in a feature over snow where AMSR cannot reliably estimate AMSR-E Land precip feature Calibrated AIRS
3. INSTANTANEOUS RATES (cont.) Month-average of Susskind et al. (1997) AIRS calibrated to AMSR-E for July 2006 - calibration by lat. bands: Ocean: 90-30°N, 30°N-S, 30-90°S Land: 90-40°N, 40·°N-S, (40-90°S) Coast: global Cal.AIRS (mm/d) July 2006 AMSR (mm/d) July 2006 - Note opposing within-band (east-west) differences - Implies regime dependence – same scaled cloud volume maps to different AMSR-E rain rates in different places Diff. (mm/d) July 2006
4. NEXT STEPS Design and implement a new AIRS cloud volume scheme based on comparison with AMSR-E and CloudSat Develop a merged AMSR-E / AIRS swath dataset - How can we gracefully transition from AMSR-E to AIRS at high latitudes and in cold/frozen land? Apply the revised cloud volume scheme to ATOVS and TOVS to develop an improved long-term record at high latitudes Throughout, particularly with the operational ATOVS, sounding retrievals work best in clear cases and worst (or fail) for precipitating cases Explore model data - Include model precip in high-lat. comparisons - Consider similar profile-based estimates for models (T and RH profiles better than precip?) - Look toward combinations of observation- and model-based estimates
5. SUMMARY Historically, we lack the physically direct sensors for high-latitude and cold-region precip that are available for tropical rain The Susskind et al. (1997) scaled cloud volume algorithm for TOVS (and AIRS) has seen successful use in GPCP Version 2 monthly and 1DD Early development work with AMSR-E and CloudSat data seems promising for an instantaneous version Once high-frequency microwave sensors/algorithms are in place, scaled cloud volume could serve at high latitudes as IR serves at low, by providing - Lower instantaneous skill, but availability to fill holes - A long record