Download
1 / 24
240 likes | 352 Views
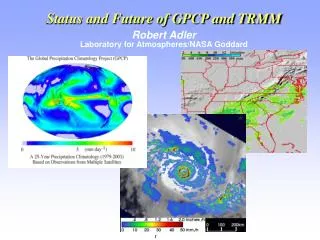
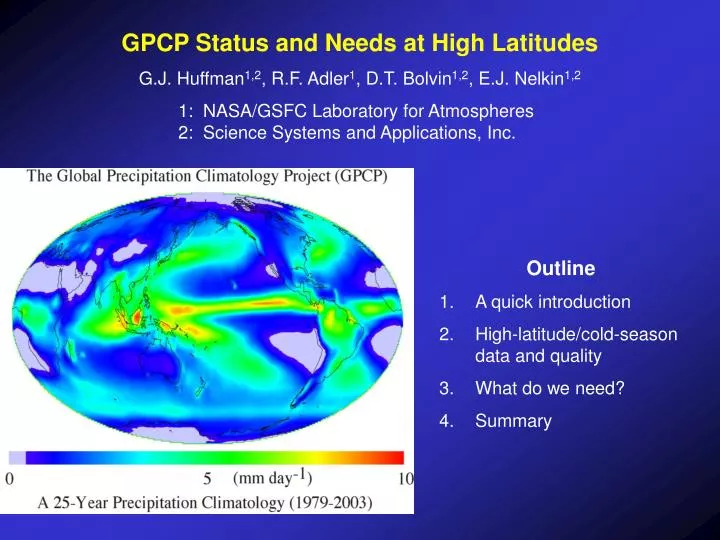
GPCP Status and Needs at High Latitudes G.J. Huffman 1,2 , R.F. Adler 1 , D.T. Bolvin 1,2 , E.J. Nelkin 1,2 1: NASA/GSFC Laboratory for Atmospheres 2: Science Systems and Applications, Inc. Outline 1. A quick introduction 2. High-latitude/cold-season data and quality What do we need?

E N D
GPCP Status and Needs at High Latitudes G.J. Huffman1,2, R.F. Adler1, D.T. Bolvin1,2, E.J. Nelkin1,2 1: NASA/GSFC Laboratory for Atmospheres 2: Science Systems and Applications, Inc. Outline 1. A quick introduction 2. High-latitude/cold-season data and quality What do we need? Summary
INTRODUCTION GPCP Objectives A WMO/WCRP/GEWEX activity • Develop, produce long-term, global precipitation analyses at monthly and finer time scales for use in studies of weather and climate variations • Characterize quality of estimates • Improve the analyses by incorporating new data, improved analysis techniques, etc. • Analyze the data sets – precipitation alone or in combination with other components of the hydrological cycle
1. INTRODUCTION GPCP Components and People • Merge Center--Adler/Huffman, NASA Goddard • Gauge Center--Rudolf/Schneider, German Weather Service, Global Precipitation Climatology Center (GPCC) • Microwave-Land Center--Ferraro, NOAA NESDIS • Microwave-Ocean Center--Chiu, George Mason U./NASA Goddard • Geosynchronous Center--Janowiak/Xie, NOAA/NWS/CPC (also pentad product, supplemental gauge analysis) • Validation Center--Morrissey, U. of Oklahoma • Additional geo-satellite data and data processing provided by JMA and EUMETSAT
1. INTRODUCTION Current GPCP Global Precip Products • Monthly, 2.5° Merged Analysis (1979-present) Adler et al. (2003) • Pentad, 2.5° Merged Analysis (1979-present) Xie et al. (2003) • Daily, 1° Merged Analysis (1997-present) Huffman et al. (2001) Note: • Input data sets and algorithms are different, but products are rescaled to agree • Produced ~ 3 months after observation time
TOVS OPI Emission Microwave Scattering Microwave Merged IR (GPI) Adj. Low- Orbit IR Microwave/Other Fusion Matched 3-hr Geo-IR Gauge-Adjusted Satellite “Microwave”/IR Calibration AGPI Multi-Satellite Gauge Satellite/Gauge 1. INTRODUCTION Version 2 Monthly Satellite-Gauge (SG) • Various input data depending on era •Sequential calibration and combination of input data 1986-87 1987-present 1979-85 Geo Low-Orbit • High-latitude and cold-season precip estimates provided by gauge, TOVS, OPI 1986-present
1. INTRODUCTION One-Degree Daily (1DD) • Similar input data, treated differently • High-latitude and cold-season precip estimates provided by TOVS, scaled by SG
1. INTRODUCTION Getting to the Future Current • Monthly estimates from selected data sets • Pentad and daily scaled to (approx.) add up to the monthly Planned • Use “all” available data to get fine time/space resolution estimates • Rescale fine-scale to account for monthly input data (gauges) • System needs to gracefully degrade/improve as satellite complement evolves Design choices • Satellite data are calibrated to a single standard • Data are combined sequentially; less-certain data are used to fill voids in more- certain data • Combinations done after calibration We need much-improved precip algorithms at high latitudes and for cold seasons
2. HIGH-LATITUDE/COLD SEASON DATA Issues Besides the classic polar regions, this issue dominates in the wintertime • U.S., episodically to the Gulf Coast • “temperate” mountains – Rockies, Andes, Himalayas, Tibetan Plateau, Alps • Europe and Siberia We are still uncertain about the possible information content of the various sensors: • sensing precip over ice, snow, frozen surface • sensing light precip (everywhere) and/or precip in a cold, dry environment We need to choose the best data sources for calibration and validation. • GPM DPR will eventually play a key role, but what to use in the meantime? • It is critical to interact with high-latitude researchers on surface precipitation data. Lower quality estimates tend to have longer periods of record; what is “good enough” for operational global data? Error estimation in high latitudes is at least as challenging as in the tropics. Key GPCP goals • devise a quality globally complete, fine-scale precipitation algorithm system • provide estimates for a substantial part of the available satellite record
Less useful More useful 2. HIGH-LATITUDE DATA Sources Accurate input data are less plentiful at high latitudes
HIGH-LATITUDE DATA Quality Mark Serreze – Arctic (2003, 2005) • mostly looked at the GPCP monthly multi-satellite (MS; i.e., before the gauge step) • compared to gauges, including ice islands, and NCEP reanalysis • better agreement in the SSM/I era • better agreement in the summer • generally low in the Ob, Venisey, and Lena River basins • variability tends to be low • the gauge adjustment is important Christian Klepp – Arctic (2001, 2005) • examined “standard” SSM/I schemes, GPCP 1DD • compared to ships of opportunity, ECMWF, Bauer and Schlüssel (1993) SSM/I algorithm for cases of intense post-frontal squalls in far North Atlantic • these squalls are relatively frequent and mostly missed – short-interval (1DD, pentad) give the wrong patterns and monthly gives the wrong totals
2. HIGH-LATITUDE DATA Quality (cont.) Chris Kidd – British Isles, zonal profiles of precip occurrence over ocean • examined “standard” SSM/I schemes • compared to gauges (British Isles), COADS ship records • detectability thresholds cause satellites to miss up to 80% of occurrence (both studies), which amount to up to 50% of accumulation (British Isles) Christophe Genthon – Antarctic (2003) • used the GPCP monthly SG • compared EOFs to EOFs for NCEP/NCAR, NCEP2, LMDZ reanalyses • results are much better in the SSM/I era • variability tends to be “different” in the mostly-SSM/I bands 40-50°N, S
2. HIGH-LATITUDE DATA Quality (cont.) Comparisons of 1DD to BALTEX gauge analysis averaged over Baltic Sea drainage basin January February
3. NEEDS Best schemes for use of current or new data sources • liquid equivalent • precip type Best scheme(s) for use of legacy data • liquid equivalent • precip type Additional sources of legacy data Validation data • fine-scale for detailed algorithm development • long-term for examining climatological statistics Agreement on a scalable, (approximately) equal-area global grid • regridding quickly damages precip statistics
4. SUMMARY • GPCP currently computes long-term, globally complete precipitation datasets at monthly, pentad, and daily intervals • For high latitudes and cold seasons, scattered validation indicates reasonable behavior • GPCP wants to go to finer-scale data sets that are still long-term and global • We need improved precip algorithms in high latitudes and for cold seasons, both for new sensors and legacy data http://precip.gsfc.nasa.gov huffman@agnes.gsfc.nasa.gov
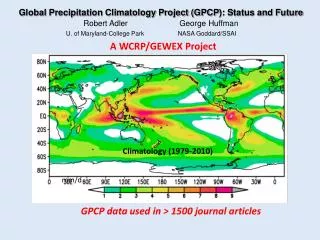
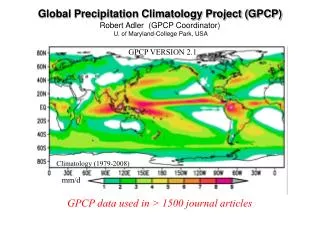
Globe 50-25°S 25-50°N 50-90°N 90-50°S 25°S-25°N Global and Regional Linear Changes in the GPCP 26-year Data Set A WCRP/GEWEX Global Data Product
GPCP Monthly Adler, R. F., G. J. Huffman, A. Chang, R. Ferraro, P. Xie, J. Janowiak, B. Rudolf, U. Schneider, S. Curtis, D. Bolvin, A. Gruber, J. Susskind, and P. Arkin, 2003: The version 2 Global Precipitation Climatology Project (GPCP) monthly precipitation analysis (1979-present). J. Hydrometeor., 4, 1147-1167. GPCP Pentad Xie, P., J. E. Janowiak, P. A. Arkin, R. Adler, A. Gruber, R. Ferraro, G. G. Huffman, and S. Curtis, 2003: GPCP pentad precipitation analyses: an experimental data set based on gauge observations and satellite estimates. J. Climate, 16, 2197-2214. GPCP Daily Huffman, G.J., R.F. Adler, M. Morrissey, D.T. Bolvin, S. Curtis, R. Joyce, B McGavock, J. Susskind, 2001: Global Precipitation at One-Degree Daily Resolution from Multi-Satellite Observations. J. Hydrometeor., 2(1), 36-50.
Microwave (mm/h) 00Z 25 May 2004 2. SOME RESULTS FROM THE MPA The merged microwave is approaching 80% coverage for a 3-hour slice of data, although it’s about 40% for Version 6 before about 2000 and the RT before 2005. TMI - white SSM/I - light gray AMSR - medium gray AMSU - dark gray
3. HIGH-LATITUDE FIRST ROUND WITH TOVS The NASA/SRT TOVS product has high fractional coverage and low rates. We start out applying probability matching to coincident data for May 2004: • using TMI, the correction was partitioned into 1 ocean and 1 land histogram - not satisfactory, as expected • using TMI, the correction was partitioned into 5 ocean and 1 land histogram - ocean zones are: 40-30°S, 30-10°S, 10°S-N, 10-30°N, 30-40°N - fairly successful within the TMI domain, but gave unreasonably high values in the Southern Ocean • using the HQ (inter-calibrated to TMI), the correction is being partitioned into 5ocean and 1 land histogram - ocean zones are: 45-20°S, 20°S-4°N, 4-9°N, 9-40°N, 40-55°N - we might move to 7 ocean bands for better match-ups - we must also examine the details over land
Coin. TOVS May 2004 (mm/d) 3. HIGH-LATITUDE FIRST ROUND WITH TOVS (cont.) The 5 ocean, 1 land histogram match against the “HQ” merged microwave for May 2004 qualitatively corrects the coverage and rate issues. • coincident sampling is reasonable • the larger coverage by high values perhaps results from a very stubbytail to the TOVS precip histogram • the fall-off in the HQ at high latitudes is forced into the cal. TOVS; this needs to be examined Coin. Cal. TOVS Coin. HQ
15 Z 26 May 2004 (mm/h) 3. HIGH-LATITUDE FIRST ROUND WITH TOVS (cont.) Choosing a particular 3-hourly time, the calibrated TOVS is markedly closer to the corresponding 3B42RT than the original. • The bands of “missing” are a feature of the processing. TOVS Cal. TOVS 3B42RT
AMSR (% precip) Feb 2004 SSM/I F13 (% precip) Feb 2004 AMSU NOAA-L (% precip) Feb 2004 3. PIXEL-LEVEL ISSUES (cont.) These maps of pixel-level fractional occurrence of precipitation for AMSR, SSM/I, and AMSU illustrate different • masks to avoid artifacts, • degrees of success in pixel-by-pixel rejection of artifacts, • sensitivities to light precip. The fractional coverage issue is most noticeable in the oceanic subtropical highs. • You can’t intercalibrate rain that doesn’t exist! • But, if there are “too many” rain events, the smallest ones can always be reset to zero.
TOVS May 2004 (mm/d) 3. HIGH-LATITUDE FIRST ROUND WITH TOVS (cont.) The 5 ocean, 1 land histogram match against the “HQ” merged microwave for May 2004 qualitatively corrects the coverage and rate issues. • these are “full”, non-coincident maps • the larger coverage by high values perhaps results from a very stubby tail to the TOVS precip histogram • the fall-off in the HQ at high latitudes is forced into the cal. TOVS; this needs to be examined Cal. TOVS HQ