Download
1 / 16
160 likes | 253 Views
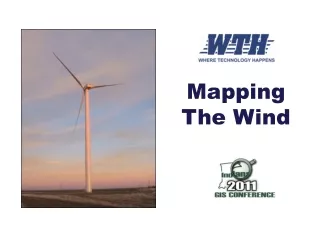
MAPPING THE WIND RESOURCES OF NORTHERN SCANDINAVIA AND THE U.K. Resource estimation in complex terrain using a full atmospheric model with very high resolution. OUTLINE. The Challenge The StormGeo Solution Validation Conclusions. THE CHALLENGE.

E N D
MAPPING THE WIND RESOURCES OF NORTHERN SCANDINAVIA AND THE U.K. Resource estimation in complex terrain using a full atmospheric model with very high resolution
OUTLINE • The Challenge • The StormGeo Solution • Validation • Conclusions
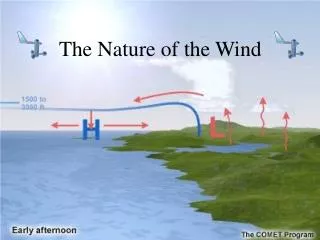
THE CHALLENGE • SITING AND RESOURCE ESTIMATION IN COMPLEX TERRAIN • Conditions can vary widely across wind farm area • Wind shear and turbulence effects can be significant • Conventional methods insufficient • Can’t have a met mast in every possible turbine position! • ”Bankable” production estimates from Norwegian wind farms UNDER-ESTIMATEDby up to 25 percent!
EXAMPLE 10 km Wind farm on island near the Norwegian coast Instant wind speeds vary from 3 to 13 m/s
StormGeo SOLUTION • FULL 3D ATMOSPHERIC MODEL • IN VERY HIGH RESOLUTION • Advantages • Resolves differences across wind farm • Handles vertical stability and shear in a realistic way • Takes coastal boundary-layer effects into account • Met mast not required • Drawbacks • Computationally demanding
MODEL HINDCASTS Global model EC – world’s best! Local models WRF Typical nesting 9 – 3 – 1 km Typical hindcast period 1-2 years
1992 1993 1989 1991 1990 THE WindSight TOOL • Combined on-line tool for siting and resource mapping • Based on pre-calculated weather model hindcasts • Calibration against available measurements • Climate correction using long-term data sets 1994 1995 1998 1996 1997 1999 2000 2002 2003 2001 2004 2005 2006 2007 2008
THE WIND MAPPER • Average wind speed • Average energy production • Wind shear • Standard deviations, min/max • Virtual measurement series
THE WIND FARM PLANNER 1 • Select turbine type • Define wind farm layout • Extract turbine point time series • Select wind distribution model
THE WIND FARM PLANNER 2 • Compute results
1989 1990 1990 1992 1991 LONG-TERM CORRECTION • EC ERA climate data: • Global • 21+ years • Every 70 km / 3 hours • All parameters • 5 levels near ground • Typical correlations in North Scandinavia: • ERA 0.8-0.9 • SYNOP 0.5-0.8 1993 1994 1995 1996 1997 2000 1999 2001 2002 1998 2003 2004 2005 2006 2007 2008 Excellent for long-term correction of hindcasts and measurements!
VALIDATION 1 Model validated against >20 measuring masts in Scandinavia Example: 48 m mast in mountainous area, Rogaland, Norway Hindcasted vs. measured wind speed, September 2007, 1h resolution Error levels, Jan-Dec 2007
VALIDATION 2 Hindcasted versus measured distributions, September 2007
CONCLUSIONS • The challenges of siting and resource mapping in • complex terrain can to a large degree be overcome • using full 3D weather model simulations • Combining simulations with measurements and • long-term re-analysis data provides a robust basis for • siting and resource estimation
THANK YOU! StormGeo www.stormgeo.com Anna Hilden anna.hilden@stormgeo.com