Download
1 / 39
390 likes | 459 Views
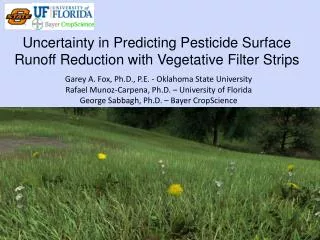
Uncertainty in Predicting Pesticide Surface Runoff Reduction with Vegetative Filter Strips. Garey A. Fox, Ph.D., P.E. - Oklahoma State University Rafael Munoz-Carpena, Ph.D. – University of Florida George Sabbagh, Ph.D. – Bayer CropScience. Organization of Presentations.

E N D
Uncertainty in Predicting Pesticide Surface Runoff Reduction with Vegetative Filter Strips Garey A. Fox, Ph.D., P.E. - Oklahoma State University Rafael Munoz-Carpena, Ph.D. – University of Florida George Sabbagh, Ph.D. – Bayer CropScience
Organization of Presentations • Introduction to Vegetative Filter Strips (VFS) • Predicting flow, sediment, and pesticide mass reduction • Development of an integrated modeling tool for VFS (VFSMOD-W) • Need for understanding parameter importance and uncertainty • Global sensitivity and uncertainty analyses applied to VFSMOD-W • Uniform flow studies - Sabbagh et al., 2009; Munoz-Carpena et al., 2010 • Uniform vs. Concentrated Flow - Poletika et al., 2009; Fox et al., 2010
Vegetative Filter Strips (VFS) • Also known as riparian buffers and grassed waterways • Take home message: • One size does not fit all! http://tti.tamu.edu/publications/researcher/v41n1/images/roadway_grass.gif
VFS Processes Increase in hydraulic resistance to flow and soil infiltration Overland flow (and dissolved pollutants) reduction (infiltration) and delay Decrease in sediment/particles transport capacity of flow Sediment/particles deposition (and pollutants bonded) in filter
VFS - Complex and Dynamic Systems • VFS efficacy is difficult to predict • Variability cannot be explained by buffer width or buffer slope alone • Large number of parameters and uncertainties need to be taken into account Liu, X., X. Zhang, and M. Zhang. 2008. Major factors influencing the efficacy of vegetated buffers on sediment trapping: A review and analysis. J. Environ. Qual. 37:1667–1674. Fox, G.A.; Sabbagh, G.J. Comment on “Major Factors Influencing the Efficacy of Vegetated Buffers on Sediment Trapping: A Review and Analysis”. J. Environ. Qual.2009, 38 (1), 1-3.
VFS - Complex and Dynamic Systems • Limited prediction equations available for pesticide reduction (DP): Predictions with simple empirical equation (SWAT) Lack of relationship with Koc Sabbagh, G.J.; Fox, G.A.; Kamanzi, A.; Roepke, B.; Tang, J.Z. Effectiveness of vegetative filter strips in reducing pesticide loading: Quantifying pesticide trapping efficiency. J. Environ. Qual. 2009, 38 (2), 762-771.
Pesticide Reduction Equation for VFS Calibration Validation R2=0.86, adjusted R2=0.84 standard error of estimate of 8.43, P-value< 0.001 Sabbagh, G.J.; Fox, G.A.; Kamanzi, A.; Roepke, B.; Tang, J.Z. Effectiveness of vegetative filter strips in reducing pesticide loading: Quantifying pesticide trapping efficiency. J. Environ. Qual. 2009, 38 (2), 762-771.
Linking Empirical Equation with VFSMOD-W • Parameters for estimating DP, such as DQ and DE, not easily predicted • Uncalibrated VFS model that predicts DQ and DE • Vegetative Filter Strip Modeling System, VFSMOD • Finite-element, field-scale, storm-based model • Routes incoming hydrograph and sedigraph • Infiltration - Green-Ampt • Sediment trapping - GRASSF
VFSMOD-W Performance DQ and DE DP Sabbagh, G.J.; Fox, G.A.; Kamanzi, A.; Roepke, B.; Tang, J.Z. Effectiveness of vegetative filter strips in reducing pesticide loading: Quantifying pesticide trapping efficiency. J. Environ. Qual. 2009, 38 (2), 762-771.
Effect of Concentrated Flow Poletika, N.N.; Coody, P.N.; Fox, G.A.; Sabbagh, G.J.; Dolder, S.C.; White, J. Chlorpyrifos and atrazine removal from runoff by vegetated filter strips: Experiments and predictive modeling. J. Environ. Qual. 2009, 38 (3), 1042-1052.
Effect of Concentrated Flow All Atrazine Block means Chlorpyrifos
Mathematical Model with 18 Input Parameters Muñoz-Carpena, R., G.A. Fox and G.J. Sabbagh. 2010. Parameter importance and uncertainty in predicting runoff pesticide reduction with filter strips. J. Environ. Qual. 39(1):1-12
So how to handle this complexity? • Key Drivers: Hydrologic response • So what do we really know? • Mathematical Models Built in Presence of UNCERTAINTY • Input factors (uncertainty sources): input variables, parameters, equations, calibration data, scale, model structure
MODEL Uncertainty Analysis (UA) • Propagates all these uncertainties, using the model, onto the model output of interest. UNCERTAINTY ANALYSIS
Sensitivity Analysis (SA) • Apportions the uncertainty in the output to different sources of uncertainty in model input For model with 2 input factors: A, B. Residual variance C TOTAL OUTPUT VARIANCE SENSITIVITY ANALISIS SENSITIVITY ANALYSIS
UA/SA Methods • Why is it important? • Explore model behavior, identify influential parameters, characterize interactions, simplify • Local vs. global sensitivity: • Local techniques inherently assume models are monotonic, linear and additive • Parameters are varied over a limited range and about an assumed central value, one at a time – interactions of parameters are not accounted for • Global analysis techniques attempt to measure total sensitivity to a parameter
Two-Step Global Process • Global SA – Screening with limited number of simulations (Morris Method) - QUALITATIVE RESULTS • Global SA and UA - Variance-based method (Extended Fourier Analysis of Sensitivity Test - Extended FAST) - QUANTITATIVE RESULTS
Step 1: Screening w/ Morris Method • Uses few simulations to map relative sensitivity • Identifies a subset of more important parameters for quantitative analysis • Provides an early indication of the importance of first order effects vs. interactions • Morris Method results in two sensitivity measures: μ* and σ σ- Interactions μ* - Importance
Step 2: Variance-Based Method • Quantifies the direct contribution to variance of each parameter • Quantifies the total contribution to variance of all the interactions between parameters • Variance decomposition requires a large number of simulations per parameter, hence the need for initial screening (Morris)
Step 2: Variance-Based Method V(Y) – variance of output, Vi – variance due input factor Xi, k – number of uncertain factors, R - residual
Quantitative Extended FAST 1. Si - first-order sensitivity index: Si = Vi / V(Y) 2. ST(i) - total sensitivity index For model with 3 parameters: A, B, and C: ST(A) = SA + SAB + SAC + SABC ST(A) STi - Si = higher-order effects
Application of Framework to VFS Studies • Uniform Flow Studies: • Arora et al. (1996), Patzold et al. (2007) and Poletika et al. (2009) • Input PDFs derived for the model’s 18 input variables • Output variables: DQ, DE, and DP
Uniform Flow Studies – Morris DQ Poletika and Patzold Arora
Uniform Flow Studies – Morris DE • Poletika and PatzoldArora
Uniform Flow Studies – Morris DP • Poletika and PatzoldArora
Uniform Flow Studies – Extended FAST • Global SA confirmed Morris results: • Removal efficiencies were not simple and were dominated by interactions and non-linear responses • VKS single most important input factor (DQ and DP) Total Output Variance Explained by an Input Parameter = First-Order Index Si = Vi / V(Y)
Uniform Flow Studies – Extended FAST • Global UA provided ranges in expected DQ, DE, and DP:
Application of Framework to VFS Studies • Uniform vs. Concentrated Flow: • Poletika et al. (2009) study included both uniform flow and concentrated flow treatments • Input PDFs derived for the model’s 18 input variables with varying FWIDTH distributions (4.6 m vs. 0.46 m) • Output variables: DQ, DE, and DP
Uniform vs. Concentrated – Morris DQ Uniform Concentrated
Uniform vs. Concentrated – Morris DE Uniform Concentrated
Uniform vs. Concentrated – Morris DP Uniform Concentrated
Uniform vs. Concentrated – Extended FAST • Global SA results: • Percent of total output variance explained by first-order effects: • 48-64% for Uniform Flow • 19-21% for Concentrated Flow • Uniform flow - DQ controlled model response under uniform flow with VKS accounting for 46-51% of total output variance • Concentrated flow – not one input factor explained more than 8% of the total output variance • Unique processes introduced into VFS during concentrated flow
Uniform vs. Concentrated – Extended FAST • Global UA provided ranges in expected DQ, DE, and DP:
Uniform vs. Concentrated – Extended FAST • Global UA provided ranges in expected DQ, DE, and DP:
Conclusions • Global SA and UA helped in the analysis of VFS • Hydraulic conductivity most important input factor for flow • Average particle diameter and conductivity most important for sedimentation • Same parameters most important for pesticide trapping • Significant interaction effects between variables, especially for concentrated flow • Global UA showed commonly observed reduction in pesticide trapping with concentrated flow
Uniform Flow Studies – Extended FAST • Global UA provided ranges in expected DQ, DE, and DP: