Download
1 / 17

E N D
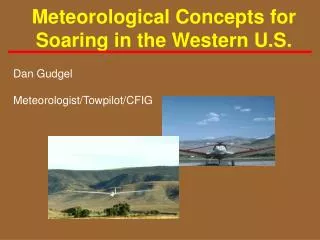
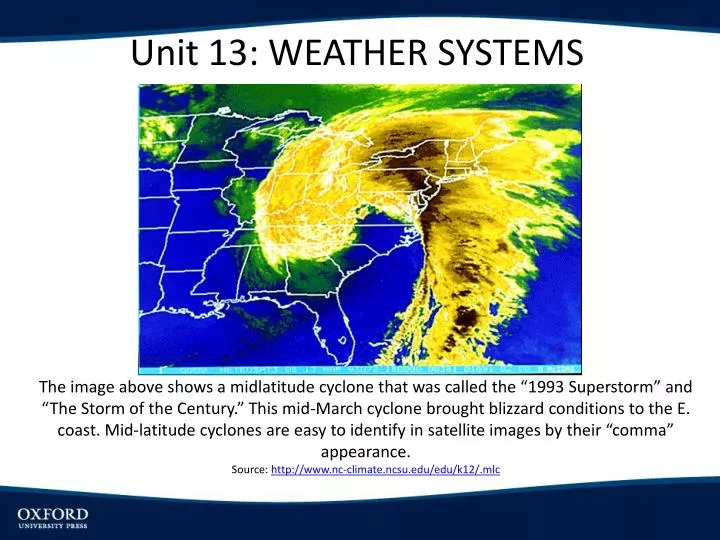
Unit 13: Weather Systems The image above shows a midlatitude cyclone that was called the “1993 Superstorm” and “The Storm of the Century.” This mid-March cyclone brought blizzard conditions to the E. coast. Mid-latitude cyclones are easy to identify in satellite images by their “comma” appearance. Source:http://www.nc-climate.ncsu.edu/edu/k12/.mlc
OBJECTIVES • Demonstrate the importance of migrating weather systems in the global weather picture • Discuss the significant weather systems of lower latitudes, including tropical storms and hurricanes • Explain weather systems of middle and high latitudes, including the formation of cyclones and the weather patterns associated with them • Examine the transformation of energy and moisture within weather systems
Weather Systems: Tropical Systems Full-disk image from GOES-14 weather satellite at 1:31 pm EST on 17 August 2009. This thermal infrared image measures radiation emission from Earth at a wavelength of 10.7 micrometers; coldest temperatures are bright white, and hottest temperatures are black. The Inter-Tropical Convergence Zone appears as a discontinuous band of thunderstorms. Tropical Storm Claudette is rapidly losing energy along the eastern Gulf Coast, Tropical Depression Ana is approaching Puerto Rico, and Hurricane Bill is building in the central North Atlantic Ocean.
Easterly Waves Easterly waves are disturbances within the trades that can produce heavy rainfall and potentially can form into tropical storms and hurricanes. The trough axis marks where the trades are converging with rising motion behind the westward moving wave, and where divergence and sinking motion occur ahead of the wave axis. Heaviest precipitation occurs in the convergence zone, while mostly sunny conditions precede the axis. Source: http://www.geography.hunter.cuny.edu/~tbw/wc.notes/11.hurricanes/easterly_wave_atl.htm
Tropical Storms and Hurricanes Tropical cyclones can form over land or water, however hurricanes always develop over warm oceans. As cyclones increase their energy, their winds increase. Storms are defined by wind speed: Tropical Depression--winds below 40 mph Tropical Storm--winds 40 to 74 mph Hurricane--winds exceed 74 mph Hurricanes may form if they occur over warm water--80F or 28C. there is an initial disturbance (ITCZ, convergence, midlatitude cyclone. there is sufficient Coriolis force. Most hurricanes form in 8-15 degrees latitude. there are weak upper air winds. Strong flow destroys formation. Hurricanes can form over all tropical oceans where these conditions are met.
Fig 14.2 The eye of Hurricane Mitch is still over water, but this 1998 storm is poised to strike Central America and will become the costliest natural disaster in the modern history of the western hemisphere. Honduras will be hit hardest, with nearly 10,000 deaths. When it is over, nearly one-quarter of the country’s 6.4 million people will be homeless, and most of the agricultural economy will be ruined.
Fig 14.3 Cross-sectional view of a hurricane showing its mechanics and component parts
Saffir–Simpson Hurricane Wind Scale • Source: Information from NOAA, National Hurricane Center.
Storm Surge Click on Image to Play Video Surge animation with shallow continental shelf (Click on Image to Play Video) Source: http://www.nhc.noaa.gov/surge/
Historic Tropical Storm and Hurricane Tracks Storm tracks of weak and severe tropical cyclones from 150 years through 2006. Weaker systems, shown in blue and yellow, occur near the equator during their early stages of development, and over land and in the middle latitudes as they lose energy and weaken. The steering of these systems by the easterly trade winds within the tropics, and the westerlies as they move into the middle latitudes is apparent. Category 4 and 5 hurricanes are most common in the western North Pacific Ocean.
North Atlantic Hurricane Season Source: http://www.nhc.noaa.gov/climo/images/peakofseason.gif
Fig 14.5 Some of the worst devastation caused by Hurricane Andrew in the suburbs south of Miami on August 24, 1992. This is part of Cutler Ridge, located just inland from where the eye wall passed over the Florida coast.
Rossby Waves in the Upper Atmosphere Westerlies 500-mb map for North America in November. The lines show the height of the 500-mb level in meters above the surface (ex. 92 equals 5920 m). There is a ridge along the W. coast with troughs over central and E. coast US. Dashed lines are temperatures in Celsius.
Polar Jet Stream and Surface Weather Relationship between the polar jet stream and surface pressure patterns. (A) Position of the jet stream 9,000 m (30,000 ft) above North America. (B) Associated air movement around points X and Y in vertical cross-section. (C) Resulting surface pressure conditions.
Life Cycle of a MidlatitudeCyclone Source: http://www.geography.hunter.cuny.edu/~tbw/wc.notes/9.weather.patterns/mid_cyclone_stages.htm
Mature Stage of a Midlatitude Cyclone Mature stage of a midlatitude cyclone over the southeastern United States. (A) Pressure fields, windflows, and fronts. (B) Cross-sectional view along the dashed line mapped in (A). The vertical scale is greatly exaggerated. Cold fronts typically rise only 1 m for every 70 m horizontal extent; for warm fronts the ratio is about 1:200. (C) Summary of surface weather conditions along the cross-sectional transect.
Midlatitude Cyclone and Vertical Circulation February 2, 2011, GOES-13 satellite image of a massive winter midlatitude cyclone moving across the eastern US. The cyclone is about 2,000 km (1,240 mi) in diameter; a large comma cloud extends from the Midwest to New England. A dry slot formed by the dry conveyor belt is faintly evident to the west of the cold front. (B) An oblique view of a midlatitude cyclone showing the relative positions of the warm conveyor belt, the cold conveyor belt, and the dry conveyor belt. (B)