Download
1 / 24
250 likes | 473 Views
Initial Investigations into the Potential and Limitations of Remote Sensed Data for Irrigation Scheduling in High Value Horticultural Crops. Outline. Background – irrigation system requirements into the future Use of NDVI in irrigation scheduling

E N D
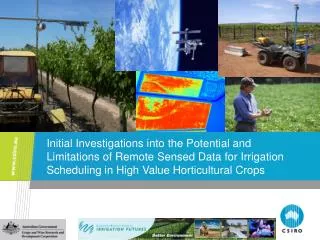
Initial Investigations into the Potential and Limitations of Remote Sensed Data for Irrigation Scheduling in High Value Horticultural Crops
Outline • Background – irrigation system requirements into the future • Use of NDVI in irrigation scheduling • Thermal – the ultimate irrigation scheduling tool?
Background • Ongoing switch from flood/furrow irrigation to drip in perennial horticulture • Supported through the Integrated Horticulture Systems Project in the Murrumbidgee Irrigation Area • Aims to see majority of horticulture converted to pressurized irrigation systems by 2010
Managing High Tech Irrigation Systems 6 Soil probes for 6 ha paddock Assume each probe measured 1m2 So we know what is happening on: • Method lacks ability to ‘see’ what is happening over the whole vineyard • Only infer the plant stress based on the soil moisture, plants can also be stressed due to a number of other factors such as soil salinity, Can we get something better ?
Large Scale Low Cost Irrigation Scheduling - NDVI for Irrigation Scheduling/Management/Benchmarking
NDVI • NDVI = (RNIR – Rred) / (RNIR + Rred) NDVI = (Band 4 - Band 3) / (Band 4 + Band 3)
Irrigation Scheduling – FAO 56 Readily available from Weather stations/SILO ETc = ETo x Kc • Relates actual water use of the crop to reference water use • Large variation and crop/management specific NDVI to Kc functional relationship
Canopy Cover and Light Interception Vs WU Williams and Ayars (2005) McClymont et al. ECC = 1.2 NDVI – 0.2 (extrapolated from Johnson and Scholasch, 2005)
Irrigation Scheduling from Remote Sensing indices Satellite, airborne or On-ground Spatial Measurements NDVI / EAS Images from Satellite or quad bike Determination of Kc from NDVI / EAS Data Incorporates management/soil/water/salinity constraints Representing Individual Paddocks ETo from Weather Station On Ground ETc = ETo X Kc Potential Evaporation based on Atmospheric Demand Actual crop evapotranspiration across regions
NDVI + ETo data Harvesting Daily delivery of tailored irrigation scheduling information direct to irrigator on SMS ETc = ETo x kc CRC IF Irrigateway server Initialisation data – system parameters Benchmarking and data mining
Uses simple SMS text messages for delivering irrigation scheduling information Will be tested with 20 horticultural growers this coming season in MIA irriGATEWAY Dripper run times (min) for Y’day: A-250, B-330, C-270. 2 days: A-510, B-620, C-545. 3 days: A-790, B-920, C-770. SMS Drip Scheduler
NAFE • NAFE 06 NDVI data will be used for fine tuning of EAS/ECC relationships to NDVI • Investigation into scaling effects from high resolution NDVI (NAFE 06) data to Landsat NDVI in relation to providing irrigation scheduling information – sensitivity analysis
Crop Water Stress Index (CWSI) Measured with IR temperature sensor or thermal camera What is CWSI? • Relates canopy temperature to an index between 0 and 1 indicating how stressed the plant is: • 0 = No stress • 1 = High stress (Tc-Ta)NTUBL (Tc-Ta)NWSBL = Non water stressed base line – equated fully open stomata and fully transpiring canopy (Tc-Ta)NTUBL = non-transpiring upper baseline –equated to temp. of non-transpiring canopy with stomata closed (Tc-Ta)NWSBL
Agrosense - Irriscan • Trials undertaken in MIA in 2002 • Collaboration with MIGAL Galilee Technology Centre, Israel • 0.1 m2 Resolution • 1250 ha per day • On-site calibration
Crop Water Stress Index (CWSI) – Jones et al. Measured with IR temperature sensor or thermal camera What is CWSI? • Relates canopy temperature to an index between 0 and 1 indicating how stressed the plant is: • 0 = No stress • 1 = High stress Tdry = upper bound for canopy temp. – equated to temp. of non-transpiring canopy with stomata closed Twet = non-stressed baseline – equated fully open stomata and fully transpiring canopy
Results Wet Reference Surfaces
NAFE • Assessment of alternative methods of determining baselines for CWSI • Comparison of PLMR data with high intensity on-ground gravimetric soil moisture content sensing
Contact Us Phone: 1300 363 400 or +61 3 9545 2176 Email: enquiries@csiro.au Web: www.csiro.au Thank you


