Download
1 / 19
190 likes | 192 Views
This study explores the effects of biomass burning emissions on air quality and public health in the United States, focusing on the indirect impacts of wildfires on the general population due to degraded air quality.

E N D
Impacts of Biomass Burning Emissions on Air Quality and Public Health in the United States Daniel Tong$, Rohit Mathur+, George Pouliot+, Kenneth Schere+, Shaocai Yu$, Daiwen Kang$, and Jeff Young+ Atmospheric Sciences Modeling Division, ARL/NOAA, RTP, NC 27711 $On assignment from Science and Technology Corporation, Hampton, VA 23666 +On assignment to NERL/EPA, Research Triangle Park, NC 27711 Chapel Hill, NC October 17, 2006
Outline • Biomass Burning Emissions for CMAQ • Methodology • Impacts on Air Quality • Impacts on Public Health • Conclusion
Background • Biomass burning includes wildfires, prescribed burning, open burning, and agricultural fires; • Wildfire is a natural disaster that claims human life and property; • Most attention has been paid to direct life and health threats, mostly to firefighters. • We focus on the indirect impact of wildfires on the general population due to degraded air quality
Methodology • Exposure • Health Impacts • Emissions • Air Quality • Integrated Assessment Approach: link emissions to pollutant concentrations, to exposure, and to health impacts • Method: • Use satellite and ground data to estimate biomass burning emissions. • Use the Eta-CMAQ air quality forecast model to link emissions to air quality. • Use calculated pollutant concentrations and population census data to estimate exposure. • Use concentration-response relationships from epidemiological studies to estimate damage.
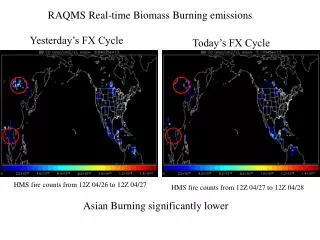
National Emission Inventories for Biomass Burning • Historic data based on multi-year state-level inventory • Accurate fire data for the year of 2002 • Spatially and temporally averaged fire data is currently used in air quality forecast operation Question: During a fire-active period, are the averaged fire emissions sufficient for CMAQ to reproduce O3 and PM observation? When there is no fire, are the persisting fire emissions too much for CMAQ?
PM2.5 During A Wildfire Episode TOMS (AAI) Origin of Fires Evolution of Fire Plumes in US PM2.5 in CMAQ (Model vs. Obs) (Source: Yu et al., 2006)
Fire Emissions and PM2.5 in Florida Fires with 2001 NEI Fires with revised NEI (Source: Pouliot et al., 2005)
Near Real-Time Fire Emissions • Use the Hazard Mapping System (HMS) product from satellites and ground data to create a real-time emission inventory for fires. Max PM2.5 Emissions Max NOx Emissions
Fire-Induced Degradation in Air Quality Ambient O3 June 19 – July 9, 2004 Difference in average concentrations (Fire – Base)
Fire-Induced Degradation in Air Quality Ambient PM2.5 June 19 – July 9, 2004 Difference in average concentrations (Fire – Base)
Health Impacts of Biomass Burning Emissions Question: What is the health consequence of degraded air quality due to biomass burning?
Mortality Estimation Method M = Y0 * Population* [exp (*c)-1] Calculate mortalities resulting from O3 or PM2.5 exposure using dose-response functions from epidemiological literature M = change in number of deaths. Y0 = annual baseline mortality rate. Population = size of affected population. = relative risk per unit change in concentration, determined from meta-analysis of epidemiological time-series studies. c = difference in ambient O3 or PM2.5 concentration between two model runs with emissions from fires turned on and off. O3 concentration-response function was derived from a time-series analyses. PM2.5 concentration-response function was taken from a cohort study which estimate total mortality resulting from chronic exposure.
Concentration-Response Functions Calculating Health Days Lost i – Age group i, N – Number of age groups
O3-related Health Impact Total: 160,591 (83,544 – 237,329, 95% CI) health days lost
PM2.5-related Health Impact Total: 465,198 (242,010 – 687,490 for 95% CI) health days lost
Conclusion • Biomass burning emissions are important for air quality during fire-active periods • --- Up to 5 ppbv increases in average O3 • --- Up to 54 ug/m3 increases in average PM2.5 • Indirect health impact of biomass burning is considerable • For the 18-day episodes: • --- 160,591 health days lost from O3 impact; • --- 465,198 health days lost from PM2.5 impact;
Future Work • Uncertainty Analysis • --- Fire emissions: fire detection, fuel loading, combustion efficiency, emission factor etc. • --- Air quality modeling • --- Exposure and health impact estimates • Annual and multi-year simulations • --- Results restricted to a 3-week simulation; • --- Annual simulation needed to obtain the total impact; • --- A multi-year simulation is needed due to large variations in fire emissions
Acknowledgement We thank Deborah Luecken, S.T. Rao, Peter Egeghy, Tom Pierce, Tom Pace, and Michelle Bell for comments Disclaimer:The research presented here was performed under the Memorandum of Understanding between the U.S. Environmental Protection Agency (EPA) and the U.S. Department of Commerce's National Oceanic and Atmospheric Administration (NOAA) and under agreement number DW13921548. This work constitutes a contribution to the NOAA Air Quality Program. Although it has been reviewed by EPA and NOAA and approved for publication, it does not necessarily reflect their policies or views.