Download

1 / 18
180 likes | 197 Views
Population Growth in a Structured Population. Glenn Ledder University of Nebraska-Lincoln http://www.math.unl.edu/~gledder1 gledder@math.unl.edu. Supported by NSF grant DUE 0536508. Population Growth. Unstructured population model: a model that counts all individuals together

E N D
Population Growth in a Structured Population Glenn Ledder University of Nebraska-Lincoln http://www.math.unl.edu/~gledder1 gledder@math.unl.edu Supported by NSF grant DUE 0536508
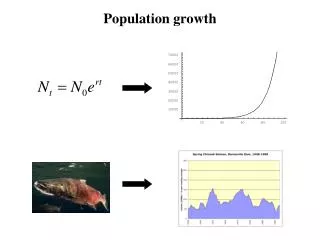
Population Growth Unstructured population model: a model that counts all individuals together (discrete exponential function bt ) Structured population model: a model that counts individuals by category (not an elementary mathematical function)
Outline • Introduce mathematical modeling. • Introduce the mathematical model concept. • Use unstructured population growth as an example. • Model structured population growth.
Mathematical Modeling Real World approximation Conceptual Model derivation Mathematical Model validation analysis • A mathematical model represents a simplified view of the real world. • We want answers for the real world. • But there is no guarantee that a model will give the right answers!
Mathematical Model Mathematical Model Input Data Output Data Key Question: What is the relationship between input and output data?
Unstructured Population Growth --Approximation Real World approximation Conceptual Model derivation Mathematical Model validation analysis • Tomorrow’s population depends only on today’s population. • All individuals alive tomorrow are born today or survive from today to tomorrow.
Unstructured Population Growth -- Derivation Real World approximation Conceptual Model derivation Mathematical Model validation analysis Nt & Nt+1: today’s and tomorrow’s populations f & s : fecundity and survival parameters Fecundity & Survival Growth Rate & Population
Unstructured Population Growth -- Analysis Real World approximation Conceptual Model derivation Mathematical Model validation analysis Fecundity & Survival Growth Rate &Population Nt=N0(f+s)t Nt+1/Nt =f+s
Unstructured Population Growth --Validation Real World approximation Conceptual Model derivation Mathematical Model validation analysis • Misses elements of chance. • Missesenvironmental limitations. • Pretty good for a short-time average.
Structured Population Growth Some populations have distinct reproductive and non-reproductive stages. • Can we make a model for a structured population? • Will we find Nt+1/Nt =f+s ?
Getting Started • A conceptual model requires scientific insight. • We should observe experiments. • Experiments for structured population growth are tricky, expensive, and time-consuming.
Presenting Bugbox-population, a realbiology lab for a virtual world. http://www.math.unl.edu/~gledder1/BUGBOX/ Boxbugs are simpler than real insects: • They don’t move. • Development rate is chosen by the experimenter. • Each life stage has a distinctive appearance. larvapupaadult • Boxbugs progress from larva to pupa to adult. • All boxbugs are female. • Larva are born adjacent to their mother.
Structured Population Dynamics Species 1: Let Lt be the number of larvae at time t. Let Pt be the number of juveniles at time t. Let At be the number of adults at time t. Lt+1 =fAt Pt+1 = Lt At+1 = Pt
Structured Population Dynamics Species 2: Let Lt be the number of larvae at time t. Let Pt be the number of juveniles at time t. Let At be the number of adults at time t. Lt+1 =fAt Pt+1 = pLt At+1 = Pt
Structured Population Dynamics Species 3: Let Lt be the number of larvae at time t. Let Pt be the number of juveniles at time t. Let At be the number of adults at time t. Lt+1 =fAt Pt+1 = pLt At+1 = Pt+aAt
Structured Population Dynamics Species 4: Let Lt be the number of larvae at time t. Let Pt be the number of juveniles at time t. Let At be the number of adults at time t. Lt+1 = sLt+fAt Pt+1 = pLt At+1 = Pt+aAt
Computer Simulation Results A plot of Xt/Xt-1 shows that all variables tend to a constant growth rate λ The ratios Lt:At and Pt:Attend to constant values.
Equation for Growth Rate Nt+1/Nt → k (constant) k(k-a)(k-s) = pf There is always a unique k that is larger than both a and s.