Download
1 / 67
680 likes | 711 Views
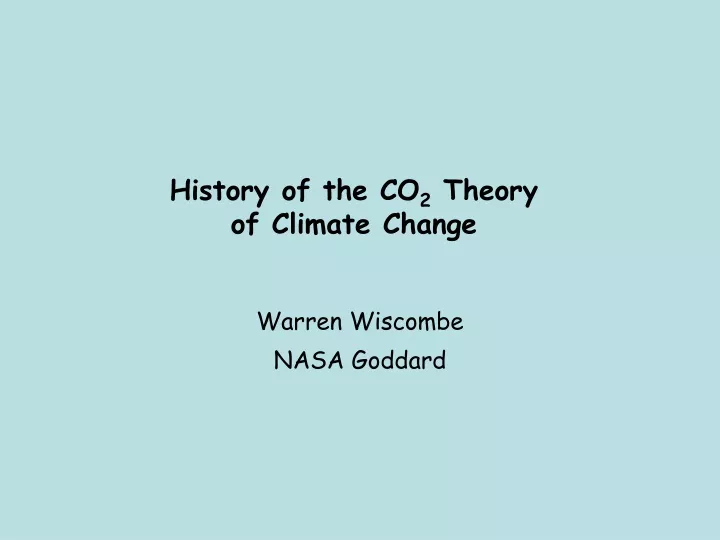
History of the CO 2 Theory of Climate Change. Warren Wiscombe NASA Goddard. “A great deal has been written about the influence of the absorption of the atmosphere upon the climate.”. Was this written by a present-day climate scientist?

E N D
History of the CO2 Theoryof Climate Change Warren Wiscombe NASA Goddard
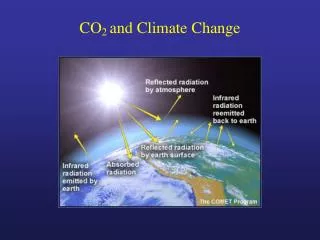
“A great deal has been written about the influence of the absorption of the atmosphere upon the climate.” Was this written by a present-day climate scientist? No, this was the first sentence of the classic 1896 paper of Nobel-Prize winning chemist Svante Arrhenius! Has the CO2-climate problem, then, riveted the attention of scientists for so long? Far from it. Decades passed without the slightest attention being paid to it. The CO2 theory of climate change has repeatedly been incinerated by its critics, only to rise again from its own ashes. We shall trace the rising and falling fortunes of this theory, as well as the historical papers which most helped to shape it. Original quotes will let the authors speak in their own words, and remind us of the elegant of use of language which characterized many of our scientific forebears. AOSC 401
Thesis Global warming theory was much more obviously correct to the physicists and chemists and geologists of the 1800s, who had great faith in their simple models and who were just discovering the relevant science. They applied the new science almost immediately to climate issues and were 100% sure that increased greenhouse gases would warm the climate. The scientists of the 1900s increasingly lost their way and wandered in the wilderness. This may partly have been because physicists the subject to chase quantum physics, leaving climate to the meteorologists, who tend not to look for simplicity, nor to find it. AOSC 401
The CO2 Theory of Climate Change:A Timeline of its Rising & Falling Fortunes 1827 (Fourier; France) no radiation theory at all Kirchhoff’s Law (absorp’y = emiss’y) crude CO2, H2O IR absorption meas’ts 1861 (Tyndall; England) better gas IR absorption measurements sT4 (Stefan-Boltzmann Law) AOSC 401
Fourier (1768-1830), French mathematician Became interested in dissipation of heat while serving Napoleon in Egypt. Proposed that the Earth’s atmosphere behaves like a “hothouse”. Misunderstood how a hothouse works — assumed that the glass let in the sun's infrared rays and reflected heat back into the structure AOSC 401
Fourier 1827: “Hothouse Effect” IR radiation emitted back toward surface keeps surface warmer than without H2O–CO2 atmosphere AOSC 401
John Tyndall (1820-1893) Investigated radiant (infrared) heat in 1859. First to show that H2O, CO2, O3 and hydrocarbons are excellent absorbers of infrared radiation and measure their “absorptive powers”. AOSC 401
Tyndall Speculates on Climate “Now if, as the above experiments indicate, the chief influence be exercised by the aqueous vapor, every variation of this constituent must produce a change of climate. Similar remarks would apply to the carbonic acid (CO2) diffused through the air, while an almost inappreciable admixture of any of the hydrocarbon vapors would produce great effects on the terrestrial [infrared] rays and corresponding changes of climate... A slight change in these variable constituents may have produced all the mutations of climate which the researches of geologists reveal.” AOSC 401
Wrote that without water vapor, Earth’s atmosphere would be “held fast in the iron grip of frost” AOSC 401
Classic Tyndall 1861 paper on IR absorption by trace gases AOSC 401
Tyndall Paper–2 AOSC 401
Gas Absorption Bands AOSC 401
Tyndall Quotes (1861) “Those who, like myself, have been taught to regard transparent gases as almost perfectly diathermanous, will probably share the astonishment with which I witnessed the foregoing effects. I was slow to believe it possible that olefiant gas, so transparent to light, could be so densely opaque to any kind of calorific rays.” “I am unable at the present moment to range with certainty O2, H2, N2, and atmospheric air in the order of their absorptive powers... Their proper action is so small that the slightest foreign impurity gives one a predominance over the other.” AOSC 401
Timeline – 2 1896(Arrhenius; Sweden) Planck’s Radiation Law Two-stream radiative transfer theory (Schuster) Earth energy budget (Dines, 1911) Disbelief Period #1 Doubters: Humphreys, Brooks (big names in climate in the 1920’s) AOSC 401
Samuel Langley (1834-1906), American physicist & engineer Bolometer Langley: Measuring Temperatures Remotely • Invented bolometer in 1878; uses fact that electrical resistivity depends on temperature. • Sensitive to very small differences in temperature. His bolometer could detect thermal radiation from a cow over 1/4 mile away! AOSC 401
Langley... • With the bolometer was able to “map” IR portion of the solar and lunar spectrum with unprecedented accuracy. • Arrhenius used Langley’s IR gas absorption data in his climate model, the first ever constructed • became deeply interested in the problem of variable solar radiation; in 1904 found that the “solar constant” is variable; also studied sunspots and tried to discern their effects on Earth. AOSC 401
Svante Arrhenius (1859-1927),Swedish physical chemist Said rising atmospheric CO2 due to human industry. Predicted doubling CO2 would increase average global temperature by ~5°C. AOSC 401
Arrhenius anticipated: Role of carbon cycle, including coal-burning (rediscovered 1950s) H2O feedback with fixed relative humidity (rediscovered 1960s) Ice-albedo feedback (rediscovered 1960s) but he lacked: – Heat transport terms in his equations AOSC 401
Arrhenius’ radiation balance equations — the first climate model AOSC 401
Arrhenius – 3 T4 = K / (2 – ea) ea = atmospheric emissivity ~ 0.7 now Surface temperature for no greenhouse effect (ea=0) is given by: T4 / T04 = [ K/(2–0.7)] / [K/2] = 2 / 1.3 T0 = 288 K ==> T – T0 = – 28 K (Manabe: – 30 K) AOSC 401
Arrhenius: First Global Climate Model Said CO2 rising in atmosphere due to human industry. AOSC 401
Arrhenius (1896) Motivation: Ice Ages Method: pure energy balance model with 21-waveband IR radiation calculation (using Langley’s measurements of transmissivity of atmosphere to IR radiation from Moon) Results for change in surface temperature: DTs = 5C for 2 x CO2 DTs ~ log[CO2] AOSC 401
Arrhenius – 5 Anticipated: – H2O feedback with fixed relative humidity (rediscovered by Moller, 1963, Manabe/Wetherald, 1967) – Ice-albedo feedback (rediscovered by Budyko, 1969) – Role of carbon cycle, inc. coal-burning (rediscovered 1950s) Lacked: – Proper IR radiative transfer – Proper T(z), humidity(z) – Proper cloud emissivity (assumed 22%) – Transport terms in energy balance AOSC 401
Chamberlin (1897) Studied CO2 vacillations over Ice-Age time scales and longer Fast time scales: CaCO3+CO2+H2O Ca++ + 2 HCO3– Slow time scales: CO2+{Ca,Mg}SiO3 {Ca,Mg}CO3+SiO2 Small perturbations in rates can alter atmospheric CO2 severalfold, because fluxes are large relative to size of atmospheric reservoir. “It is obvious that the factor which is at once minimum in quantity and maximum in participation must necessarily be the critical factor of the atmosphere.” AOSC 401
CO2 IR absorption bands are “saturated” H2O absorbs in same IR spectral region Disbelief Period #1 AOSC 401
Beginnings of Climate Theory (also Milankovitch theory that Ice Ages are caused by variations in Earth’s orbit) AOSC 401
Timeline – 3 1938(Callendar; England) more CO2 IR absorption measurements (but none for H2O!) (a book was written about him recently) Disbelief Period #2 Doubts: (1) Earth cooling not warming; (2) extra CO2 absorbed by ocean, biota AOSC 401
Callendar (1938) Assumed net infrared radiation at surface is constant: (1–S1) s T14 = (1–S2) s T24 1 x CO2: S1 = 0.7000 2 x CO2: S2 = 0.7058 T2 = T1 [ (1–S1) / (1–S2) ] 1/4 ==> T2 – T1 = 1.4 K dTs / dFnet = [ (1–S) 4 s Ts3 ] –1 = 0.6 K / [W/m2] First to tout man’s role in CO2 balance. (at the lower limit of present estimates, and got this close only due to compensating errors — too little H2O vapor with too high an absorption) AOSC 401
Callendar – 2 Improvements over Arrhenius: Planck function, not sT4 proper IR radiative transfer theory correct T(z), humidity(z) H2O overlap with CO2 bands role of ocean chemistry better CO2 absorption data Backsliding: no clouds surface energy balance only assumes net IR flux at surface constant AOSC 401
The Callendar Roast at Ye Olde Royal Meteorological Society As an “outsider” (a steam technologist), he was politely but firmly snubbed by the meteorologists of the Royal Society... Sir George Simpson: “It is not sufficiently realized by non-meteorologists who come to help the Society in its study, that it is impossible to solve the problem of the temperature distribution in the atmosphere by working out the radiation. The atmosphere is not in a state of radiative equilibrium.” Prof. David Brunt: “...the effect of an increase in the absorbing power of the atmosphere would not be a simple change of temperature, but would modify the general circulation, and so yield a very complicated series of changes in conditions.” AOSC 401
Callendar Strikes Back Mr. L. Dines: “Was Mr. Callendar satisfied the change in the temperature of the air which he had found [in the historical record] was significant, and not merely a casual variation?” Callendar replies: “If any substance is added to the atmosphere which delays the transfer of low temperature radiation, without interfering with the arrival or distribution of the heat supply, some rise of temperature appears to be inevitable in those parts which are furthest from outer space.” AOSC 401
Disbelief Period #2 Rising temperature trend from 1880 reversed around 1940 and a cooling commenced. Nature itself had rejected the CO2 theory. AOSC 401
Timeline – 4 1950’s (Revelle, Keeling, Plass; U.S.) CO2 monitoring starts (IGY, 1957) Revelle: oceans take only 1/2 of extra CO2 much better H2O absorption meas’ts Disbelief Period #3 Doubters: Kaplan, Moller (pure radiation modelers) AOSC 401
Began measuring CO2 levels in mid-1950s as part of International Geohpysical Year (IGY) Measured 314 ppm in 1958, which he compared to George Callendar’s calculation of 290 ppm in 1900 Increase visible at South Pole after only two years. Charles Keeling: Climate-Quality CO2 Measurements First published graph by Keeling, Tellus, 1960. AOSC 401
Charles Keeling... • Previous meas’ts were bedeviled by random vacillations in CO2. Vegetation inhales CO2 in day & exhales it at night. • used a recording spectrophotometer, an instrument others had thought too sensitive (and expensive) for such work. • His observational program taken over by NOAA, 1974 (who added CH4, N2O, O3, CFCs) AOSC 401
Keeling: His Famous Graph The first icon of global change. Annual oscillations are biosphere inhaling and exhaling AOSC 401
1958 Roger Revelle (1909-1991), U.S. Oceanographer. Interested in air-sea interface and draw-down of CO2 into deep ocean. Searched for saturation points and rates. Roger Revelle (1909-1991): CO2 in the Oceans In 1936 Revelle began studying the chemical interaction of CO2 with seawater. He left the subject, returning in 1956 to discover that the absorption of CO2 was taking place at a much lower rate than he or anyone else had thought. His first published statements to this effect were taped on to a manuscript just before publication (revealed from his archives at Scripps). AOSC 401
Revelle wrote the now legendary "human beings are now carrying out a large scale geophysical experiment" • 1957: Revelle and Hans Suess, a founder of radiocarbon dating, demonstrated in a famous article in Tellus that CO2 had increased in the air as a result of burning fossil fuels. • Revelle chaired National Academy of Sciences Energy and Climate Panel in 1977, which found that ~40% of the anthropogenic CO2 has remained in the air, • Of that, 2/3 was from fossil fuel, and 1/3 from forest clearing. AOSC 401
1987 Bulletin Amer. Meteor. Soc., v20, p. 397 A 1937 Historical Footnote... What Me Worry? AOSC 401
Plass (1954–57) “50 years ago, the CO2 theory was perhaps the most widely held theory of climatic change, but in recent years it has had relatively few adherents. However, recent research suggests that the usual reasons for rejecting this theory are not valid.” Rejection Reason #1: “The usual objection, found in almost every textbook, is that H2O vapor absorbs in the same spectral region as CO2.” BUT... “The individual spectral lines of those gases occur at random with respect to each other; detailed calculation shows that they only slightly interfere.” AOSC 401
Gas absorption (normalized) Overlapping gas absorption bands are just collections of narrow lines which don’t overlap AOSC 401
Plass – 2 FURTHERMORE... “The percentage of H2O vapor in the atmosphere falls off very rapidly with height, whereas CO2 is nearly uniformly distributed.” H2O scale height ~ 2 km CO2 scale height ~ 8 km so...the effect of H2O becomes negligible just a short distance above the surface, and CO2 is thus unimpeded above 2–3 km. AOSC 401
Plass – 2b Rejection Reason #2: “CO2 cannot cause a temperature change at the surface of the Earth because the CO2 band is always completely opaque at any reasonable concentration.” BUT... “This completely neglects the many hundreds of spectral lines that are more than 1 mm from the band center.” (the band wings) AOSC 401
Plass – 3 Motivation: Ice Ages Method: surface energy balance, empirical dTs/dFIR Better because of: (a) computers! (b) new detailed CO2 absorption meas’ts Did ocean chemistry calculations — but concluded that “the surface layers can absorb only a small fraction of the extra CO2 in a period of several hundred years.” Result:DTs = 3.5C for 2 x CO2 (Callendar: 1.4C; Arrhenius, 5C) Ignored: (1) Clouds (DTs = 2C when included) (2) H2O overlap with CO2 band (3) all feedbacks AOSC 401
Plass – 4 CO2 monitoring: “Unfortunately, we cannot say with certainty whether or not the CO2 content of the air has increased since 1900... In view of the importance of this factor for the climate, these meas’ts should be made regularly at several locations.” Meteorological bloopers: (1) Thought global-avg temperature still rising (stopped in 1940) (2) “the increased cloud cover as the CO2 amount decreases [??] prevents the Sun’s rays from reaching the Earth and further reduces the surface temperature” (3) “increased convection within a cloud due to the larger temperature difference between its upper and lower surfaces should...increase the average precipitation” AOSC 401
Callendar’s Last Hurrah (1958) Did a painstaking survery of all historical CO2 measurements. Result: 290 ppm (pre-1900) Noted contamination by: – cities – nocturnal boundary layer stagnation – insufficient averaging – seasonal cycle Noted polar-ocean CO2 sinks: 225 ppm, Arctic ice margin (1948) 256 ppm, 56°S (1882) 205 ppm, 65°S (1911) “...one suspects that the final answers to this problem lie in the chill darkness of the ocean abyss.” AOSC 401
Kaplan (1960) Claimed better method & better CO2 absorption data than Plass. Said that Plass: (a) overestimated surface radiation change by 44% (b) neglected clouds, which cause a further 50% reduction Result: DTs = – 1.8 C for 0.5 x CO2 (would be further reduced by H2O overlap) 1.1 x CO2 ==> DTs < 0.25 C, so, he said, 0.6 C warming in 1880–1940 not caused by CO2! AOSC 401