Download
1 / 33
330 likes | 454 Views
CO 2 and Climate Change. 3.25. 4.25. 5.25. Lisiecki & Raymo, 2005. black body. A theoretical object that absorbs all incoming electromagnetic radiation. It emits radiation as a function of temperature. Sun (T~ 5780°K). Earth (T~ 255°K). Wavelength (microns). Blackbody temperature

E N D
3.25 4.25 5.25 Lisiecki & Raymo, 2005
black body A theoretical object that absorbs all incoming electromagnetic radiation. It emits radiation as a function of temperature.
Sun (T~ 5780°K) Earth (T~ 255°K) Wavelength (microns) Blackbody temperature The sun radiates primarily in the visible. Earth radiates in the IR. Earth has a blackbody Temperature below the freezing point of water.
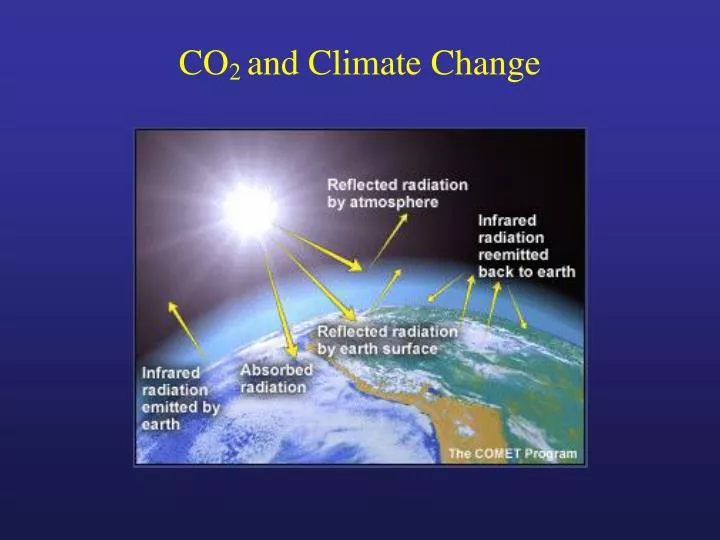
Greenhouse effect Atmosphere allows visible light to pass, but ‘greenhouse’ gases (H20, CO2, CH4) trap outgoing infrared and warm the Earth.
Epica Dome C ice core (Antarctica) CO2 (greenhouse gas) and D (temperature) vary repeatedly through multiple glacial cycles. The variations are approximately 90 ppmv. CO2 (ppmv) D (‰) Temperature Siegenthaler et al. (2005)
Vostok ice core (Antarctica) CO2 and D are nearly in phase. Both lead 18O atm O2 (ice volume). Both lead Greenland D and 18O ice (Northern hemisphere temperature). Time
Phase relationships (relative timing) These allow us to rule out several possible mechanisms for driving the CO2 changes. Vostok ice core (Antarctica) CO2 and D are nearly in phase. Both lead 18O atm O2 (ice volume). Both lead Greenland D and 18O ice (Northern hemisphere temperature).
Carbon reservoirs Most carbon is in solid earth. Ocean has most of the rest (60:1) Atmosphere small reservoir, but important!
Isotopic fractionation Stable isotope fractionation may be diagnostic tool.
Carbon reservoirs Different carbon pools are isotopically distinct.
Climate, ocean and land CO2 Climate changes themselves cannot account for the observed changes in CO2. Changes in the terrestrial biosphere, evident in carbon isotopes in the ocean, are too small to explain CO2 change, and they indicate a shift in the wrong direction!
Biological pumps to change atmospheric CO2 Productivity near the sea surface changes the chemistry of both the surface and deep ocean.
Coral reef hypothesis Growth of coral reefs on flooded margins as sea level rises would have the effect of increasing atmospheric pCO2, but the timing is wrong.
Phosphate burial hypothesis Burial of phosphate and other nutrients on shelves as sea level falls, and then release during sea level rise would have the right effect on atmospheric pCO2, but again, the timing is wrong.
Influence of pumps Various pumps would have differing effects on atmospheric pCO2, and also on the isotopic composition of dissolved inorganic carbon (DIC).
Productivity Biological activity results in systematic changes in concentration and isotopic ratio of bio-limiting and bio-intermediate elements.
Carbon isotopes Photosynthetic fractionation of organic carbon leaves seawater enriched in heavier carbon-13. The resulting Isotopic ratio in seawater is then incorporated in CaCO3, providing a nutrient-tracer.
Isotopic influences Photosynthetic fractionation results in a strong negative correlation between nutrients and carbon isotopes. Gas exchange, local productivity, and global reservoir shifts can also influence 13C. So 13C can be used as a tracer for water masses (circulation), although gradients are more reliable than the absolute values.
The meridional overturning circulation (MOC) produces North Atlantic Deep Water (NADW). NADW GEOSECS Evident in salinity and many other properties…
The meridional overturning circulation (MOC) produces North Atlantic Deep Water (NADW). NADW Kroopnick (1985) Also evident in carbon isotopes (13C).
LGM meridional section, western basin Paleocean circulation The configuration was different, but not the rate of circulation? Curry and Oppo (2005)
Cadmium as a tracer Dissolved cadmium is strongly correlated with phosphate and nitrate. Cd a “nutrient” tracer High Cd = high nutrients
Cadmium as a tracer Dissolved cadmium in bottom water is reflected in benthic foraminifera shells.
Ocean circulation ‘Biological pump’ and ‘conveyor belt’ combine to distribute nutrients and ‘nutrient proxies’ in ocean.
Combined proxies Both carbon isotope and cadmium tracers support repeated glacial to interglacial changes in ocean circulation combine to distribute nutrients and ‘nutrient proxies’ in ocean.
Nutrient changes and pCO2. Changes in the inventory or whole ocean distribution of nutrients could explain the observed shifts in pCO2. But there is no evidence for change in whole ocean inventory, and no evidence for widespread oxygen depletion in the deep ocean. Signal is most evident in Atlantic, and is most likely circulation.
Nutrient shift Carbon isotopes suggest a wholesale shift to lower values. Cadmium harder to discern. If anything, there is a small change to lower values in glacial, opposite required shift.
Ocean carbon shift Mean ocean isotopic ratio changed during ice age.
Focus on Southern Ocean It is the main region where deep ocean and in atmosphere are in nearly direct contact.
Southern Ocean Nutrient utilization (dust?), stratification (sea ice?), and/or circulation combined with carbonate compensation Remain the leading explanations for CO2 change.
Atmospheric CO2 IGreenhouse gases and the temperature of the Earth IIIce core evidence that glacial pCO2 was 80 ppm lower. IIICould it be due to terrestrial biosphere change? No! IVHow did the ocean do it? Physical - chemical property changes (T, S) Physical pumps Biological pumps (nutrients, Corg, alkalinity)