Download
1 / 33
330 likes | 333 Views
M. Amann, I. Bertok, R. Cabala, J. Cofala, F. Gyarfas, C. Heyes, Z. Klimont, K. Kupiainen, W. Winiwarter, W. Sch öpp. Baseline emission projections and scope for further reductions in Europe up to 2020 Results from the CAFE analysis. Approach for baseline emission projections.

E N D
M. Amann, I. Bertok, R. Cabala, J. Cofala, F. Gyarfas, C. Heyes, Z. Klimont, K. Kupiainen, W. Winiwarter,W. Schöpp Baseline emission projectionsand scope for further reductions in Europe up to 2020Results from the CAFE analysis
Approach for baseline emission projections • Match RAINS estimates with nationally reported emission inventories for 2000 • Use projections on emission generating activities (energy, transport, agriculture) • EU-wide scenarios and national projections • Extrapolate penetration rates of control measures up to 2020 • Taking account of international and national legislation
National inventory RAINS estimate RAINS emission estimates vs. national inventories, 2000 SO2 NOx VOC NH3
National inventory RAINS estimate RAINS PM emission estimates vs. national inventories, 2000 PM10 PM2.5
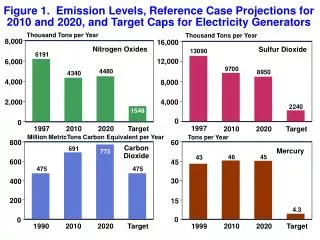
Projections of economic activitiesused for the CAFE baseline scenarios Energy • Revised PRIMES projection for all 25 EU countries, with climate measures (carbon price 12-20 €/t CO2) • Including national comments received after April • DG-TREN Energy Outlook to 2030 (PRIMES calculations for all 25 EU countries, without further climate measures) • National projections (10 countries) - with climate measures? Agriculture • DG-AGRI projection for all 25 EU countries, pre-CAP reform • National projections (10 countries)
Land-based emissions CAFE “With climate measures” baseline, EU-25
Range of SO2 emission projections[kt] ----- EU-15----- New Member States---- Sea regions
Range of NOx emission projections[kt] -----EU-15----- New Member States---- Sea regions
The scope for further emission reductions through technical measures
Long-term trends of EU-25 emissions“With climate measures” projection, relative to year 2000 [= 100%]
Maximum Technically Feasible Reductions (MTFR) General assumptions • Full application of measures included in RAINS database (following IPPC BREF notes) • No premature scrapping and no retrofitting beyond current legislation • Maximum reductions also applied in non-EU countries and sea regions
Scope for further technical emission reductionsCAFE “with climate measures” baseline, EU-25
Scope for further non-technical emission reductions“Illustrative climate” vs. “with climate measures” scenario, EU-25 100% 80% 60% 40% 20% 0% SO2 NOx VOC NH3 PM2.5 2000 CLE-2020 "with climate measures" CLE 2020 "Illustrative climate" MTFR-2020 "with climate measures" MTFR 2020 "Illustrative climate"
Projected PM emissions in Europe2000-2020 EU-15 EU-10 Non-EU
Impact assessment • All calculations for 2020 • All impact assessments for 1997 meteorology
RAINS impact assessmentSeven endpoints • Loss in life expectancy attributable to anthropogenic PM • Premature deaths attributable to ozone • Vegetation damage from ozone (AOT40) • Excess of critical loads for acidification for forest soils • Excess of critical loads for acidification for semi-natural ecosystems • Excess of critical loads for acidification for lakes • Excess of critical loads for eutrophication More endpoints evaluated in CAFE Cost-Benefit Analysis
Loss in life expectancy attributable to anthropogenic PM2.5 [months] • 2020 2020 • Current legislationMTFR Loss in average statistical life expectancy due to identified anthropogenic PM2.5Calculations for 1997 meteorology Provisional estimates with generic assumption on urban increment of PM
Premature deaths attributable to ozone[cases per year] Provisional estimates based on grid average ozone concentrations, 1997 meteorology
Vegetation-relevant ozone concentrationsAOT40 [ppm.hours] • 2020 2020 • Current legislationMTFR Critical level for forests = 5 ppm.hours Calculations for 1997 meteorology
Acid deposition to forests • 2020 2020 • Current legislationMTFR Percentage of forest area with acid deposition above critical loads, using ecosystem-specific deposition, Calculation for 1997 meteorology
Acid deposition to forests% of forest area with acid deposition above CL
Acid deposition to semi-natural ecosystems including HABITAT areas • 2020 2020 • Current legislationMTFR Percentage of area of semi-natural ecosystems with acid deposition above critical loads using ecosystem-specific deposition. Calculation for 1997 meteorology
Acid deposition to semi-natural ecosystems including HABITAT areas [% of ecosystems area]
Acid deposition to freshwater bodies • 2020 2020 • Current legislationMTFR Percentage of catchments area with acid deposition above critical loads, using ecosystem-specific deposition. Calculation for 1997 meteorology
Acid deposition to freshwater bodiesPercentage of catchments area with acid deposition above CL
Excess of critical loads for eutrophication • 2020 2020 • Current legislationMTFR Percentage of ecosystems area with nitrogen deposition above critical loads using grid-average deposition. Calculation for 1997 meteorology
Excess of critical loads for eutrophicationPercentage of ecosystems area with nitrogen deposition above CL
Conclusions • Emissions in the EU-25 will continue to decline in the future with progressing implementation of current legislation (except ammonia). • However, air quality problems will remain. • There is scope for further emission reductions: • Starting from the “with climate measures” PRIMES projection, relatively little AQ improvements from more aggressive climate policies • Significant scope from further technical measures beyond current legislation • Different regions in Europe experience different environmental problems. • No consultations with non-EU countries up to now.