Download
1 / 15
150 likes | 267 Views
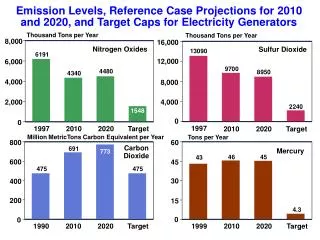
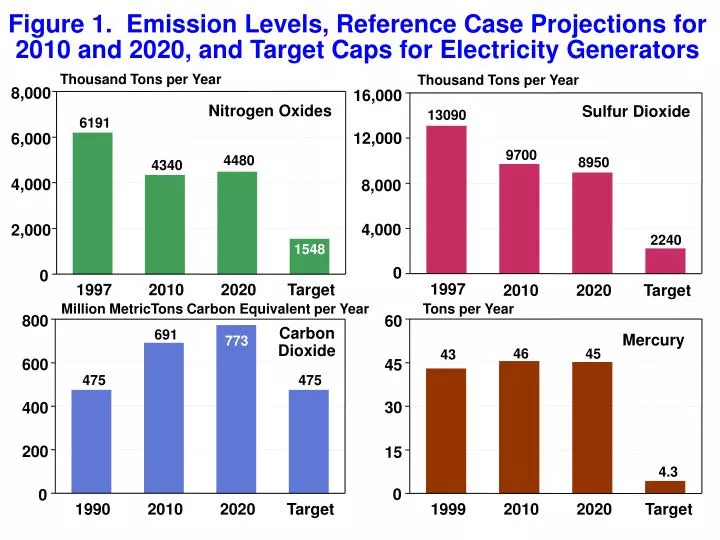
Figure 1. Emission Levels, Reference Case Projections for 2010 and 2020, and Target Caps for Electricity Generators. Thousand Tons per Year. Thousand Tons per Year. 8,000. 16,000. Nitrogen Oxides. Sulfur Dioxide. 13090. 6191. 12,000. 6,000. 9700. 4480. 8950. 4340. 4,000. 8,000.

E N D
Figure 1. Emission Levels, Reference Case Projections for 2010 and 2020, and Target Caps for Electricity Generators Thousand Tons per Year Thousand Tons per Year 8,000 16,000 Nitrogen Oxides Sulfur Dioxide 13090 6191 12,000 6,000 9700 4480 8950 4340 4,000 8,000 4,000 2,000 2240 1548 0 0 1997 1997 2010 2020 Target 2010 2020 Target Million MetricTons Carbon Equivalent per Year Tons per Year 800 60 Carbon Dioxide 691 Mercury 773 46 45 43 600 45 475 475 30 400 200 15 4.3 0 0 1990 2010 2020 Target 1999 2010 2020 Target
Figure 2. Electricity Prices With and Without Emissions Limits, 1990-2020 (1999 cents per kilowatthour) 10 Without Emissions Limits With Emissions Limits 8 6 4 2 0 1990 1999 2005 2010 2015 2020
Figure 3. Electricity Sales With and Without Emissions Limits, 1970-2020 (billion kilowatthours) 5,000 Without Emissions Limits With Emissions Limits 4,000 3,000 2,000 1,000 History Projections 0 1970 1980 1990 2000 2010 2020
Figure 4. Projected Electricity Generation from Coal, Natural Gas, and Renewable Fuels (Excluding Cogenerators) With and Without Emissions Limits, 2010 and 2020 (billion kilowatthours) 3,000 Coal Natural Gas Renewables 2010 2020 2,500 2,000 1,500 1,000 500 0 Without Emissions Limits With Emissions Limits Without Emissions Limits With Emissions Limits
Figure 5. Sulfur Dioxide Allowance Price With and Without Emissions Limits, 2005-2020 (1999 dollars per ton) 400 Without Emissions Limits With Emissions Limits 200 0 2005 2010 2015 2020
Figure 6. Carbon Dioxide Allowance Price, 2005-2020 (1999 dollars per metric ton carbon equivalent) 125 With Emissions Limits 100 75 50 25 0 2005 2010 2015 2020
Figure 7. Nitrogen Oxides Allowance Price, 2005-2020 (1999 dollars per ton) 1,400 With Emissions Limits 1,200 1,000 800 600 400 200 0 2005 2010 2015 2020
Figure 8. Mercury Allowance Price, 2005-2020 (million 1999 dollars per ton) 600 With Emissions Limits 500 400 300 200 100 0 2005 2010 2015 2020
Figure 9. Impact of 2010 Allowance Prices on Coal Plant Operating Costs (1999 cents per kilowatthour) 4.0 Mercury Carbon Dioxide 3.5 Sulfur Dioxide 3.0 2.5 2.0 1.5 1.0 0.5 0 Unscrubbed Coal Plant Without SCR Scrubbed Coal Plant With SCR
Figure 10. Impacts of Emission Limits on Cumulative Resource Costs for Electricity Generation, 2001-2020 (billion 1999 dollars) 200 177 150 100 50 0 Change from Reference Case Without Emissions Limits
Figure 11. Natural Gas Wellhead Prices With and Without Emissions Limits, 1990-2020 (1999 dollars per thousand cubic feet) 4 Without Emissions Limits With Emissions Limits 3 2 1 0 1990 1999 2005 2010 2015 2020
Figure 12. Coal Production With and Without Emissions Limits, 1970-2020 (million short tons) 1,400 Without Emissions Limits 1,200 1,000 With Emissions Limits 800 600 400 200 History Projections 0 1970 1980 1990 2000 2010 2020
Figure 13. Impacts of Emission Limits on Delivered Energy Consumption in the Reference Case, 2010 and 2020 (quadrillion Btu) 0.2 2010 2020 0.1 0.0 -0.1 Residential Commercial Industrial -0.2 Transportation -0.3 -0.4 -0.5
Figure 14. Allowance Prices Based on Emission Caps in the Smith/Voinovich/Brownback Analysis 2020 Allowance Prices 3,000 90,000 85,000 2,825 Nitrogen Oxides 75,000 2,500 Sulfur Dioxide Mercury 2,000 60,000 1,737 Mercury in 1999 Dollars per Pound Sulfur Dioxide and Nitrogen Oxides in 1999 Dollars per Ton 45,000 1,500 1,000 30,000 15,000 500 200 0 0 Reference 75 Percent
Figure 15. Changes in Cumulative Resource Costs of Electricity Generation in the Smith/Voinovich/Brownback Cases