Download
1 / 6
70 likes | 160 Views
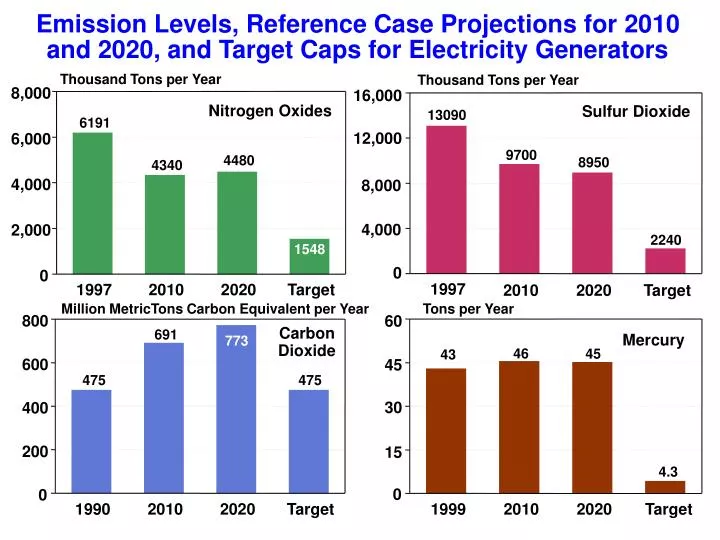
Emission Levels, Reference Case Projections for 2010 and 2020, and Target Caps for Electricity Generators. Thousand Tons per Year. Thousand Tons per Year. 8,000. 16,000. Nitrogen Oxides. Sulfur Dioxide. 13090. 6191. 12,000. 6,000. 9700. 4480. 8950. 4340. 4,000. 8,000. 4,000.

E N D
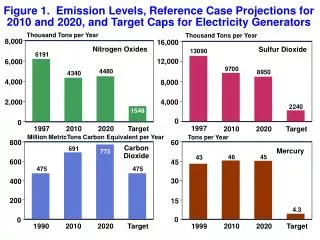
Emission Levels, Reference Case Projections for 2010 and 2020, and Target Caps for Electricity Generators Thousand Tons per Year Thousand Tons per Year 8,000 16,000 Nitrogen Oxides Sulfur Dioxide 13090 6191 12,000 6,000 9700 4480 8950 4340 4,000 8,000 4,000 2,000 2240 1548 0 0 1997 1997 2010 2020 Target 2010 2020 Target Million MetricTons Carbon Equivalent per Year Tons per Year 800 60 Carbon Dioxide 691 Mercury 773 46 45 43 600 45 475 475 30 400 200 15 4.3 0 0 1990 2010 2020 Target 1999 2010 2020 Target
Electricity Prices With and Without Emissions Limits, 1990-2020 (1999 cents per kilowatthour) 10 Without Emissions Limits With Emissions Limits 8 6 4 2 0 1990 1999 2005 2010 2015 2020
Natural Gas Wellhead Prices With and Without Emissions Limits, 1990-2020 (1999 dollars per thousand cubic feet) 4 Without Emissions Limits With Emissions Limits 3 2 1 0 1990 1999 2005 2010 2015 2020
Emission Allowance Prices in the Reference Case With Emissions Limits, 2020 200,000 400 153,000 150,000 221 Sulfur Dioxide, Nitrogen Oxides, and Carbon Dioxide in 1999 dollars per ton Mercury in 1999 dollars per pound 100,000 200 122 50,000 0 0 0 Sulfur Dioxide Nitrogen Oxides Carbon Dioxide Mercury
Change in Coal vs. Natural Gas, Renewable, and Nuclear Generation and Electricity Demand, 2020 (billion kilowatthours) 1,500 1,000 Electricity Demand Nuclear Renewable 500 Natural Gas 0 -500 -1,000 Coal -1,500
Impact of 2010 Allowance Prices on Coal Plant Operating Costs (1999 cents per kilowatthour) 4.0 Mercury Carbon Dioxide 3.5 Sulfur Dioxide 3.0 2.5 2.0 1.5 1.0 0.5 0 Unscrubbed Coal Plant Without SCR Scrubbed Coal Plant With SCR