Download
1 / 15
150 likes | 268 Views
A Quantitative Overview to Gene Expression Profiling in Animal Genetics. Sensitivity. A Simple Method for Computationally Inferring Microarray Sensitivity. Reverter & Dalrymple BioInfoSummer 2003, AMSI, ANU, Canberra “Best Talk”.

E N D
A Quantitative Overview to Gene Expression Profiling in Animal Genetics Sensitivity A Simple Method for Computationally Inferring Microarray Sensitivity Reverter & Dalrymple BioInfoSummer 2003, AMSI, ANU, Canberra “Best Talk” A Rapid Method for Computationally Inferring Transcriptome Coverage and Microarray Sensitivity Reverter et al. 2005 Bioinformatics 21:80-89 Armidale Animal Breeding Summer Course, UNE, Feb. 2006
A Quantitative Overview to Gene Expression Profiling in Animal Genetics MPSS Test Data No Tags = 25,503 S 1 S 2 100.00 100.00 57.14 49.87 36.11 33.66 10.89 10.74 5.73 5.67 1.21 1.13 0.57 0.55 0.15 0.11 0.05 0.05 cDNA Noise Paper PNAS 02, 99:14031 100.00 56.19 36.79 11.76 6.95 1.94 1.11 0.29 0.16 Sensitivity Motivation • Empirical Distribution of Tags MPSS Paper, Jongeneel et al. PNAS 03, 100:4702 tpm N Tags % > 1 (0.0) 27,965 100.00 5 (0.7) 15,145 54.16 10 (1.0) 10,519 37.61 50 (1.7) 3,261 11.66 100 (2.0) 1,719 6.15 500 (2.7) 298 1.07 1,000 (3.0) 154 0.55 5,000 (3.7) 26 0.09 10,000 (4.0) 7 0.02 Armidale Animal Breeding Summer Course, UNE, Feb. 2006
A Quantitative Overview to Gene Expression Profiling in Animal Genetics Sensitivity Motivation • Empirical Distribution of Tags • Universal distribution associated with stochastic processes of gene expression (Kuznetsov, 2002) • Framework for a mapping function: • Concentration Signal Armidale Animal Breeding Summer Course, UNE, Feb. 2006
A Quantitative Overview to Gene Expression Profiling in Animal Genetics Sensitivity Motivation • Mapping: Concentration Signal Arrays 97 Signals 3,544,000 Mean 1,724 Intensity % > 1 100.0 280 56.4 560 36.6 2,800 12.1 5,600 6.7 28,000 0.9 40,000 0.4 55,000 0.2 65,000 0.1 x % 0.0 100.00 0.7 56.19 1.0 36.79 1.7 11.76 2.0 6.95 2.7 1.94 3.0 1.11 3.7 0.29 4.0 0.16 Armidale Animal Breeding Summer Course, UNE, Feb. 2006
A Quantitative Overview to Gene Expression Profiling in Animal Genetics Sensitivity Definition of Sensitivity References: Kane et al. 2000 Lemon et al. 2003 Zien et al. 2003 Brown et al. 1996 O’Malley & Deely, 2003 • Not from Confidence (1 –) • Not from Formulae: • More like Minimum Detectable Concentration/Activity • “The smallest concentration of radioactivity in a sample that can be detected with a 5% Probability of erroneously detecting radioactivity, when in fact none was present (Type I Error) and also, a 5% Probability of not detecting radioactivity when in fact it is present (Type II Error).” • If = , then Sensitivity = Confidence Armidale Animal Breeding Summer Course, UNE, Feb. 2006
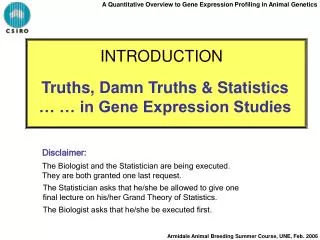
A Quantitative Overview to Gene Expression Profiling in Animal Genetics Market Equilibrium ! Sensitivity Inspiration Economics 101 Quantity Supply Demand $ Price Armidale Animal Breeding Summer Course, UNE, Feb. 2006
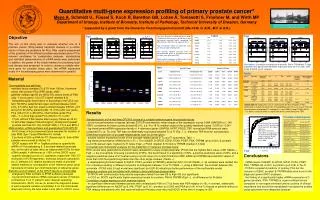
A Quantitative Overview to Gene Expression Profiling in Animal Genetics …example: 164,318 Records 6,051 Total Genes 183 Diff. Expressed Genes x Threshold All Genes DE % DE 0.0 1 100.00 100.00 3.02 0.7 312 54.16 99.45 5.55 1.0 566 37.61 97.81 7.87 1.7 3,417 11.66 46.45 12.05 2.0 5,414 6.15 27.32 13.44 2.7 13,936 1.07 5.46 15.45 3.0 17,096 0.55 3.83 21.03 3.7 26,477 0.09 0.00 0.00 4.0 30,378 0.02 0.00 0.00 Sensitivity Process …for a given microarray experiment: • From all the genes, find the intensity thresholds that define • Apply these same threshold to the set of Differentially Expressed Genes. • The ratio of 2./1. Meets at the Equilibrium defining Sensitivity. Armidale Animal Breeding Summer Course, UNE, Feb. 2006
A Quantitative Overview to Gene Expression Profiling in Animal Genetics 6051 x 0.0615 = 372 183 x 0.2752 = 50 50/372 = 13.44% Sensitivity Process All Genes DE % DE Cat_1 (1) 100.00 100.00 3.02 Cat_2 (5) 54.16 99.45 5.55 Cat_3 (10) 37.61 97.81 7.87 Cat_4 (50) 11.66 46.45 12.05 Cat_5 (100) 6.15 27.32 13.44 Cat_6 (500) 1.07 5.46 15.45 Cat_7 (1000) 0.55 3.83 21.03 Cat_8 (5000) 0.09 0.00 0.00 Cat_9 (10000) 0.02 0.00 0.00 Armidale Animal Breeding Summer Course, UNE, Feb. 2006
A Quantitative Overview to Gene Expression Profiling in Animal Genetics % Flat line (except Upper Bound) x Sensitivity Inferential Validity Let NT = N of “Total” Genes ND = N of “Differentially Expressed” Genes (ND NT) • The relevance of f(xi) is limited to the Concentration Signal mapping. • At equilibrium the probability of an error either way equals. Armidale Animal Breeding Summer Course, UNE, Feb. 2006
A Quantitative Overview to Gene Expression Profiling in Animal Genetics Sensitivity Mechanism INPUT: (1) Gene ID – (2) Avg Intensity – (3) DE Flag i=1 cat_nde(i) = nde ! For each category compute cat_pde(i) = 100.0 * nde/ntot ! N and Prop of DE Genes DO i = 2, 9 j = ntot - int(ntot*cat(i)/100.00) ! Pointer Location of threshold m = 0 ! Counter for DE genes found so far DO k = 1, ntot IF( gene(k)%deflag > 0 )THEN m = m + 1 IF( gene(k)%intens > int(gene(j)%intens) )THEN cat_nde(i) = nde-m+1 cat_pde(i) = 100.0*(cat_nde(i)/(ntot*(cat(i)/100.0))) EXIT ENDIF ENDIF ENDDO WRITE(10,1000)i,cat(i),100.0*cat_nde(i)/nde,cat_pde(i) ENDDO Armidale Animal Breeding Summer Course, UNE, Feb. 2006
A Quantitative Overview to Gene Expression Profiling in Animal Genetics Sensitivity Application Examples (validation?) …from CSIRO Livestock Industries: • ARRAYS GENES • Total DE • Wool Follicles 10 6,051 183 • Beef Cattle Diets 14 6,816 450 • Pigs Pneumonia 16 6,456 307 • M Avium ss avium 13 132 47 • Callow et al. (2000) 16 6,384 320 • Lin et al. (2002) 2 27,007 1,350 • Lynx MPSS test data 2 25,503 8,284 …from Non-CSIRO Livestock Industries: Armidale Animal Breeding Summer Course, UNE, Feb. 2006
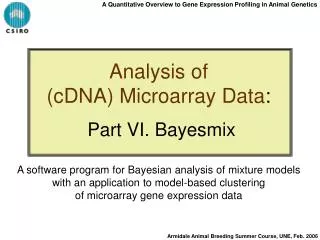
A Quantitative Overview to Gene Expression Profiling in Animal Genetics Sensitivity Application Examples (validation?) Armidale Animal Breeding Summer Course, UNE, Feb. 2006
A Quantitative Overview to Gene Expression Profiling in Animal Genetics 130 tpm …..I’ve seen them worse 80 tpm …..a ball-park figure 40 tpm …..possibly real 25 tpm …..possibly optimistic 5 tpm …..as Lynx claims Sensitivity Application Examples (validation?) Armidale Animal Breeding Summer Course, UNE, Feb. 2006
A Quantitative Overview to Gene Expression Profiling in Animal Genetics Sensitivity Inferential Validity < = > Not many DE genes High Confidence Few False +ve Lots of DE genes High Power Few False -ve Armidale Animal Breeding Summer Course, UNE, Feb. 2006
A Quantitative Overview to Gene Expression Profiling in Animal Genetics Sensitivity Conclusions • We are looking at the Sensitivity of the Experiment, not the Sensitivity of the Microarray Technology. • The proposed method is Very Simple and Very Fast. • Results acceptable but could be affected by: • N Arrays in a given experiment • Quality of the Arrays themselves • Quality of the RNA extracted • Statistical approach to identify DE • Degree of Dissimilarity between samples • The impact of (3.a … 3.e) is not necessarily bad. Armidale Animal Breeding Summer Course, UNE, Feb. 2006