Download
1 / 8
80 likes | 166 Views
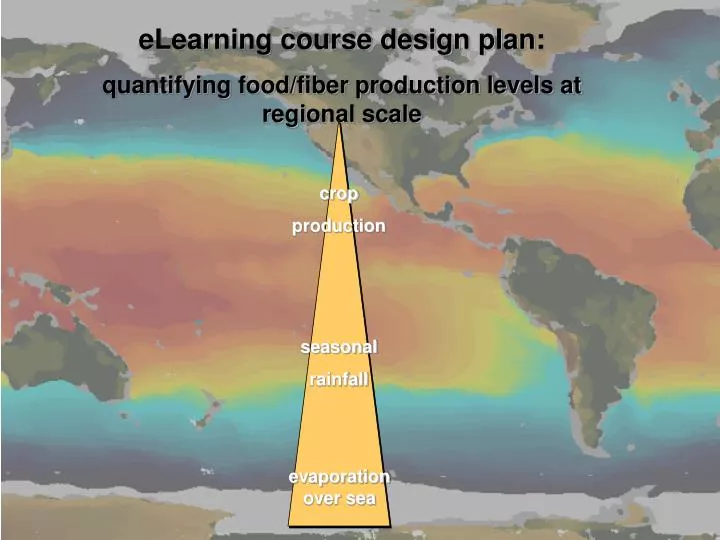
eLearning course design plan: quantifying food/fiber production levels at regional scale. crop production. seasonal rainfall. evaporation over sea. PEDAGOGIC MODEL.

E N D
eLearning course design plan: quantifying food/fiber production levels at regional scale crop production seasonal rainfall evaporation over sea
PEDAGOGIC MODEL • The ITC learning environment is built on the metaphor of a pyramid, which represents a progression of scientific knowledge that can be used to understand the natural world. • At the base of the pyramid are fundamental principles, basic immutable physical laws (such as Newton's Laws) that are applicable to all of nature. Processes, the next level up, are combinations of fundamental principles that scientists apply in diverse contexts. An example of a process block in atmospheric science is the notion of buoyantly driven ascent. This exploits Newton's Laws (as well as the equation of state and gravity) to explain vertical motion in phenomena as diverse as ocean currents, mantle convection, and thunderstorms. Phenomena represent the top level of the pyramid. • One important feature of our model is that learning need not progress in a particular order. The topics and activities are designed to accommodate various approaches: • Starting with a careful elucidation of fundamental principles and showing how they interact in key processes, which, in turn, determine the behavior of large-scale processes. • Examining a phenomena and explaining it in terms of interacting sub-processes, which are in turn explained by fundamental principles.
Where does the rain come from? • Insert VGEE curriculum • The topics are organized using an inquiry strategy: • Topic 1 involves examining datasets to describe ENSO. Learners look for patterns and try to build relations between them. • Topics 2, 3, and 4 involve examining the overall patterns discovered in the first topic and explaining them. These topics can be ordered independently and represent explanations for three different patterns apparent in normal years: • Clouds in the Western Pacific • Clear skies in the Eastern Pacific • The horizontal wind across the Pacific • Topics 5 and 6 integrate the various explanations into a systems perspective. Topic 5 integrates the patterns into a Pacific-wide circulation system, examines that system for internal consistency, and investigates the feedbacks within the system. Topic 6 compares the Pacific-wide circulation in the various phases of ENSO. This represents a final integration of the knowledge throughout the circulation, but could equally well serve as the start of a new inquiry. Learners have explained why the phases are the way they are; they can then investigate the reasons that phases transition.
PEDAGOGIC MODEL • We have arranged the topics in the Learner Guide according the latter approach, with learners moving down the pyramid (from phenomena to principle) and back up. • They identify phenomena in topic 1. • They learn to recognize and relate patterns in topics 2, 3, and 4. • They integrate the patterns to explain the phenomena in topics 5 and 6. • If you choose to follow this approach, feel free to change the order of topics within the latter two groups (2/3/4 and 5/6). (For more information, see Organization of Topics below.)
TOOLS FOR LEARNING • In the phenomenon level of the pyramid, learners construct visualizations using geophysical datasets in the Visualization Environment and use the visualizations to discover underlying processes. They then explore fundamental principles using concept models (probes in idealized environments). Finally, they return to the Visualization Environment and use probes to investigate the visualizations and integrate the fundamental principles with the phenomena.
2. Where does the rain fall? • How to measure rainfall? • What causes spatial variation? • What causes temporal variation? • What application – crop productivity: • Which crop? • What is the phenolgy (LGP)? • Standard LGP, or year-specific (additional)? • AERAF - Agrometeorological ENSO Rainfall Analysis and Forecast Model • Aggregating (SUM) rainfall over the growing season.
3. How much can grow? • Quantifying production level under water-limited (rainfed) conditions: • Basics of agro-meteorological production models • Primary plant functions and effects of water stress • Input requirements and acquisition of data • Dealing with uncertainty in model and input data • Running a production model • Forecasting production levels using AERAF
How much will be harvested? • Forecasting production levels using AERAF