Download

1 / 43
450 likes | 727 Views
Spectral response at various targets. Mirza Muhammad Waqar Contact: mirza.waqar@ist.edu.pk +92-21-34650765-79 EXT:2257. RG610. Course: Introduction to RS & DIP. Outlines . Satellite Sensor Pushbroom vs Wiskbroom Sensors Spectral Signature Spectral Reflectance Curve of Snow

E N D
Spectral response at various targets Mirza Muhammad Waqar Contact: mirza.waqar@ist.edu.pk +92-21-34650765-79 EXT:2257 RG610 Course: Introduction to RS & DIP
Outlines • Satellite Sensor • PushbroomvsWiskbroom Sensors • Spectral Signature • Spectral Reflectance Curve of Snow • Spectral Reflectance Curve of Vegetation • Spectral Reflectance Curve of Soil, Water and Cloud
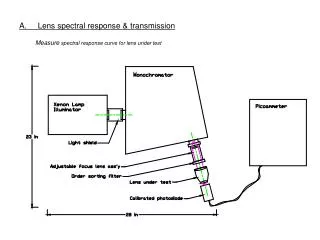
PushbroomvsWiskbroom Sensors Spectrometer
Spectral Signature • Every natural and synthetic object on the earth’s surface and near surface • Reflects & Emits • EMR over a range of wavelengths in its own characteristic way according to its • Chemical composition • Physical state.
Spectral Signature • Spectral characteristics do not remain static rather change with • Geographic location • Time. • For example, forest canopy may be green in July, red, yellow or brown in September.
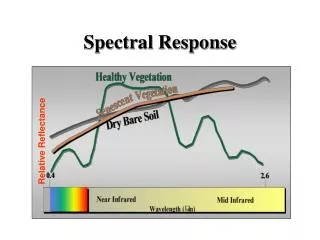
Spectral Reflectance Curves / Signatures • Spectral reflectance curves are graphical representations of the spectral response of a certain type of features as a function of wavelength. Each feature has its own unique spectral reflectance curve. These curves are defined by the varying percent of reflectance.
Spectral Signature – Image Interpretation • Plotting the spectral reflectance curves in graphic format will allow us • To determine which bands are most useful for discriminating certain type of features. • The higher the contrast (gaps) between the signature curves of any two types of features: • The easier it should be to distinguish them • The greater the potential is for fast and accurate image interpretation and mapping.
What is Snow? • Snow is actually a form of precipitation in the form of ice crystals. • These ice crystals are hexagonal prisms. • Snowflakes -- Collections of snow crystals • Rime -- Super cooled tiny water droplets that quickly freeze onto whatever they hit. • Grapuel -- Loose collections of frozen water droplets, • Hail -- Large, solid chunks of ice
Spectral Properties of Snow It depends upon the following snow parameters ; • Grain Size and Shape • Impurity Contents • Near Surface Liquid Water Content • Depth And Surface Roughness • Solar elevation
Spectral Properties of Snow • Fresh fallen snow has a very high reflectance in the visible wavelengths. • As snow ages, the reflectivity of snow decreases in the visible and specially in the NIR wavelengths. • This decrease in reflection is due to melting and refreezing with in the surface layers and to the natural addition of impurities. • Melting of snow increase the mean grain size and density.
Continued… • In the wavelength region between approximately (0.65 -1.4 micro m); the difference in snow crystal radius leads to the greater difference in the reflection. • The greater the size of grain the greater will be the decrease in the reflection. • The reflection of glacier ice is quite low. • But the glacier ice covered with snow increases the reflection. • Presence of melt water decreases the reflection.
Distinguishing Snow and Cloud • Snow and cloud has same reflectance in visible portion of the spectrum. • So how can we discriminate between these two features …???
Continued… • Snow can be distinguished From Cloud in middle infrared band • At the wavelength of 1.6 m, snow has very low reflectance, while the reflectance of clouds remains high.
Vegetation • Vegetation covers a large portion of the Earth's land surface. • Obtaining quantitative information about vegetation with remote sensing has proven difficult • All vegetation is chemically similar, and most healthy plants are green showing absorption bands .
Types of vegetation • Broad leaf • Conifers • Shrubs & herbs • Grasses
Internal structure of leaf • Epidermis: protects the leaf and is transparent to let light through. • Palisade mesophyll : cells are tall and closely packed to absorb maximum light. They contain many chloroplasts. Most photosynthesis takes place in the palisade cells.
Contd.. • Spongy mesophyll: also captures light and makes food. Spongy mesophyll cells have air spaces between them to allow easy gas exchange. • Veins :contain xylem (top part of vein) for water transport and phloem (lower part of vein) to take away dissolved food.
Contd.. • Stomata :(mostly on the underside of the leaf) allow gas exchange; since a lot of water vapor can be lost through the stomata they only open for photosynthesis in daylight. • At night they close to reduce loss of water vapour.
Major factors of Vegetation Mapping • Chlorophyll and other pigments • Structural biochemical molecules • Water absorption bands
Mesophyllvs NIR Reflectance • Lots of palisade mesophyll = low NIR reflectance • Lots of spongy mesophyll = higher NIR reflectance
The Red Edge The Red Edge
MIR REGION (1350-2500 nm) Moisture Contents • Beyond 1300 nm incident energy upon vegetation is essentially absorbed or reflect. • The dips in the reflectance occur at 1400, 1900and 2700nm; because water in the leaves strongly absorb energy in these wavelengths; often known as “WATER ABSORPTION BANDS”. • The peaks in this region occur at 1600 & 2200 nm.
Spectral Characteristics Viewer • http://landsat.usgs.gov/tools_viewer.php