Download

1 / 19
230 likes | 310 Views
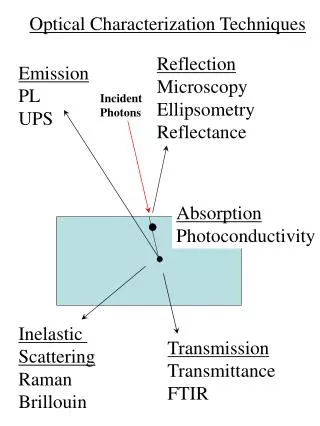
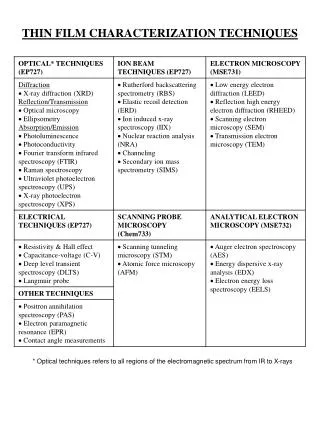
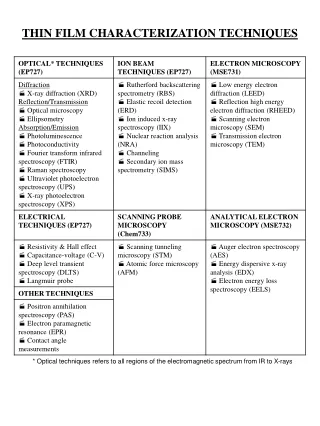
Optical Characterization Techniques. Reflection Microscopy Ellipsometry Reflectance. Emission PL UPS. Incident Photons. Absorption Photoconductivity. Inelastic Scattering Raman Brillouin. Transmission Transmittance FTIR. Optical Characterization Techniques.

E N D
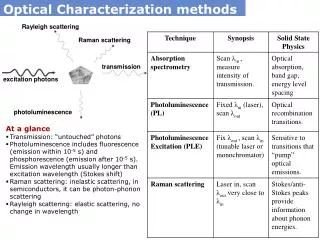
Optical Characterization Techniques Reflection Microscopy Ellipsometry Reflectance Emission PL UPS Incident Photons Absorption Photoconductivity Inelastic Scattering Raman Brillouin Transmission Transmittance FTIR
Optical Characterization Techniques • Advantages : • Non-destructive • No contacts required • High sensitivity, • < 1012 cm-3 impurity detection
Spectroscopy From Hollas, Fig. 3.1, p. 42
Spectroscopy • Need a dispersive element to separate wavelengths • 4 ways of performing spectroscopy Prism Grating Interferometer Michelson Interferometer (FTS) Fabry-Perot Interferometer
Prisms • Remember Newton • Wavelengths are separated by the wavelength dependence of refractive index • Dispersion, dn/dl • Resolving power, R = b dn/dl From Hollas, Fig. 3.3, p. 44
Grating Monochromator • Wavelengths are separated spatially by a diffraction grating • Requires a lock-in amplifier for good S/N LaPierre, Ph.D. thesis
Grating Monochromator • Resolving power: • R = l/Dl=mN • m = diffraction order • N = # of grooves • R ~ 104 • can resolve • 0.05 nm from l = 500 nm • Usually used in the uv, visible and near-infrared region • Mid- and far-infrared dispersion is more effectively performed by FTS
Interferometers • Interference can result in dispersion of wavelengths • Remember oil slicks
Fabry-Perot Interferometer • Constructive interference occurs in transmission • for wavelengths satisfying (normal incidence): 2d = mlo/n1 multi-wavelength source, Dl plate spacing d = mlo/2n1 n1 I detector l lo
Fabry-Perot Interferometer • The F-P transmission is given by the Airy function • F = 4R/(1-R)2 • = 4pn1d/ lo (normal angle of incidence) R = mirror reflectivity 1 1 + Fsin2(d/2) T = T d
Fabry-Perot Interferometer • Want a high coefficient of finesse for a narrow transmission • F = 4R/(1-R)2 • Want high reflectivity mirrors T d
Fabry-Perot Interferometer Resolving power: R = l/Dl½ R = l / (2l/mp√F) R = mp√F / 2 R > 106 is achievable can resolve 0.0005 nm from l = 500 nm T 1 0.5 Dl½ = 2l/(mp√F) l
Fourier-Transform Spectroscopy (FTS) M2 Michelson interferometer BS source M1 P frequency spectrum source interferogram I I laser (long lc) w mirror position I I LED (short lc) w mirror position • large lc (e.g., laser) wide interferogram • short lc (e.g., LED) narrow interferogram
Fourier-Transform Spectroscopy (FTS) • The frequency spectrum is the Fourier transform • of the interferogram Fourier transform frequency spectrum source interferogram I I laser (long lc) w mirror position I I LED (short lc) w mirror position
FTS • Reference spectrum is taken with sample removed from system • Sample is placed in one arm of interferometer • Intensity (interferogram) is measured at detector, P, as a function of mirror position • Fourier transform (FFT) of interferogram gives spectral content of input (includes absorption spectrum from sample) M2 sample input wavelengths (broadband source) M1 BS P
FTS • FTS usually used in the near-, mid-, and far-infrared wavelength range • Also called Fourier transform infrared spectroscopy (FTIR spectroscopy) • Strong absorption by H2O; must purge optical path with N2 • Windows in the system must be transparent to the wavelengths of interest
FTS from Hollas, Table 3.1, p. 60
FTS • Advantages of FTS compared to monochromator or F-P : • Whole spectrum is measured at once (Fellget advantage) • Large energy throughput; large input/output aperture (Jacquinot advantage) • Better S/N ratio • Fast measurement • Resolving power limited by mirror displacement (d) : • R = l / Dl = 2d / l • e.g., mirror displacement of d = 0.5 cm R = 20000 • Dl = 0.025 nm at 500 nm