Download
1 / 13
140 likes | 368 Views
Population aging. LDC Broader base and narrower top. The growth will continue MDC more rectangular and bull-eye shape. Diminishing number of persons in the labour force. Aging process in both regions. Age composition. How to measure the aging process

E N D
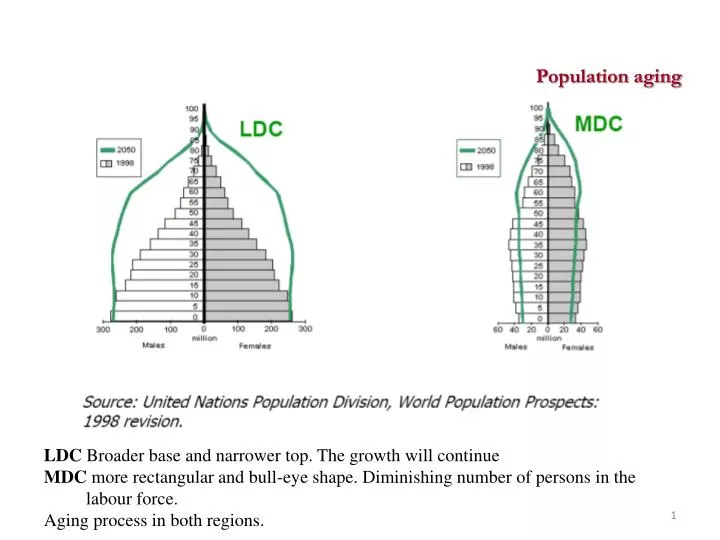
Population aging LDC Broader base and narrower top. The growth will continue MDC more rectangular and bull-eye shape. Diminishing number of persons in the labour force. Aging process in both regions.
Age composition How to measure the aging process We need to summarize the age distribution. Starting from data used for age pyramids (population by sex and age) we can compute: Mean age For 5-years age groups
Age composition Example. Mean age for the total population k is the mid-point for the older age group (in this case we can put 80)
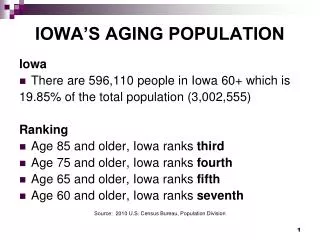
Age composition Median age: if you order all the individuals by age (in a certain point in time), the median age is the age of the individual in the central position of the ordered list (half the population is older and half is younger). Median age (1999 – extremes in the world) Uganda (world’s youngest population) 17.5 Italy (world’s oldest population - now after Japan) 39.9 median age of voters Example: the median age of population aged 18+ (voters) is increasing in all Western countries.
Age composition • Does it means that our destiny is gerontocracy? • The aging of electorate can direct economic resources towards old age individuals still further. • In Italy, in 2000 the social expense was distributed as follows: • 61% pensions (retirement pensions, old-age pensions, survivorship pensions, widow’s pensions, disability pensions) • 23% health services (directed primarily to the elderly) • about 85% of the whole welfare was directed to the elderly. • Moreover, in Italy more than 50% of workers retire before 60 years of age. a closer look: Italy However, if we want to compare different population, mean and median age are not good indicator since they can have similar values even with very different age distributions. Therefore, we need some other unambiguous measures for the aging process.
Population aging Ratio of pop. 65 and older to pop. under 15. Sometimes it is expressed as Aging ratio Age dependency ratio Ratio of persons in the “dependent ages” to those “economically productive”. It is composed by two ratios: - Young dependency ratio (Idy) - Elderly dependency ratio (Ide) NOTE: This ratios are usually expressed as percentages and are referred to a specific point in time (usually we use census data)
Population aging Aging ratio = 131.4 % Age dep. ratio = 49.0 % Young dep. ratio =21.2% Elderly dep. ratio=27.8 % ITALY 2001 Old population. Burden of elderly. Aging ratio = 4.2% Age dep. ratio = 114.1 % Young dep. ratio =109.5% Elderly dep. ratio=4.6 % UGANDA 2000 Young population. Large burden of children.
Population aging CHINA
Population aging % of 65+ Labour force replacement ratio Ratio of people that are entering into the working age to those who are exiting from working age. >1 strong replacement capacity <1 low replacement capacity EEU Eastearn Europe NAF Northern Africa WAF Western Africa Labour force replacement ratio Results (2005): - Japan similar to Italy. - Germany is “old” but still has a good change rate. - Aging process in the Eastern Europe
Sex composition is able to influence various demographic (births, marriages) and socio-economic behaviours. It is influenced by • proportion at birth (about 104-106 males every 100 females); • differential sex mortality; • differential patterns of migration for males and females; • selective abortion, infanticide, child abandonment sex ratio age-specific sex ratio
Sex composition World: 101 men every 100 women In the more developed countries: the sex ratio has progressively lowered in the last century (due to the gain in the old age mortality for women). Now it is around 93-95. The sex ratio remain higher than 100 in countries where the woman condition is worse (Asia, Mideast, Northern Africa): India and China 107 Pakistan 108 Egypt and Siria 105
Sex composition Ratio 106/100 (see one child certificate)
References Weeks, Population, Chapter 8 Other sources G. Caselli, W. Wunsch, J.Vallin, Demography. Analysis and synthesis (vol I). M. Livi Bacci “A coincise history of world population”. chapter 5. A. Golini, La popolazione del pianeta, Il Mulino, chapter 5.