Download
1 / 32
330 likes | 454 Views
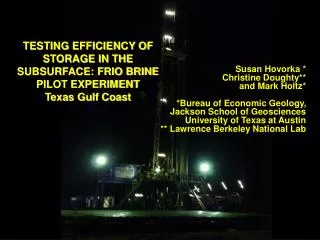
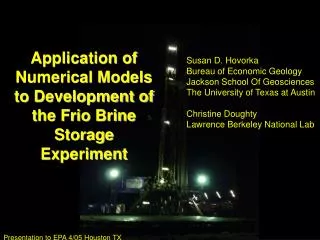
Application of Numerical Models to Development of the Frio Brine Storage Experiment . Susan D. Hovorka Bureau of Economic Geology Jackson School Of Geosciences The University of Texas at Austin Christine Doughty Lawrence Berkeley National Lab. Presentation to EPA 4/05 Houston TX.

E N D
Application of Numerical Models to Development of the Frio Brine Storage Experiment Susan D. Hovorka Bureau of Economic Geology Jackson School Of Geosciences The University of Texas at Austin Christine Doughty Lawrence Berkeley National Lab Presentation to EPA 4/05 Houston TX
Frio Brine Pilot Research Team • Bureau of Economic Geology, Jackson School, The University of Texas at Austin: Susan Hovorka, Mark Holtz, Shinichi Sakurai, Seay Nance, Joseph Yeh, Paul Knox, Khaled Faoud, Jeff Paine • Lawrence Berkeley National Lab, (Geo-Seq): Larry Myer, Tom Daley, Barry Freifeld, Rob Trautz, Christine Doughty, Sally Benson, Karsten Pruess, Curt Oldenburg, Jennifer Lewicki, Ernie Majer, Mike Hoversten, Mac Kennedy • Schlumberger: T. S. Ramakrishna, Nadja Mueller, Austin Boyd, Mike Wilt • Oak Ridge National Lab: Dave Cole, Tommy Phelps, David Riestberg • Lawrence Livermore National Lab: Kevin Knauss, Jim Johnson • Alberta Research Council: Bill Gunter, John Robinson, Bernice Kadatz • Texas American Resources: Don Charbula, David Hargiss • Sandia Technologies: Dan Collins, “Spud” Miller, David Freeman; Phil Papadeas • BP: Charles Christopher, Mike Chambers • SEQUIRE – National Energy Technology Lab: Curt White, Rod Diehl, Grant Bromhall, Brian Stratizar, Art Wells • Paulsson Geophysical – Bjorn Paulsson • University of West Virginia: Henry Rausch • USGS: Yousif Kharaka, Bill Evans, Evangelos Kakauros, Jim Thorsen • Praxair: Joe Shine, Dan Dalton • Australian CO2CRC (CSRIO): Kevin Dodds, Don Sherlock • Core Labs: Paul Martin and others
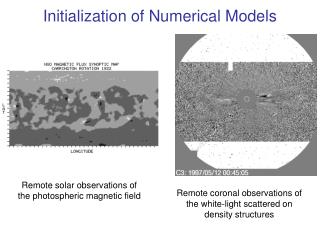
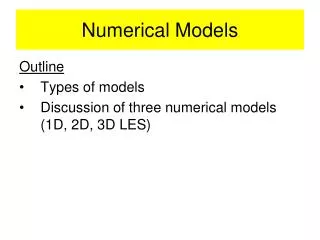
Categories of Models 1) Planning models (2) Predictive models (3) Calibration models All models shown used LBNL TOUGH2 Other co-operating modeling teams: UT-CPGE, PNL, Schlumberger
Evolution of Frio Project – Role of Modeling Planning 1 2
Pilot site Selecting the Frio Formation as an Optimal Unit to Store CO2 20 miles Modified from Galloway and others, 1982 6/2000
Generic Frio Model – Effect of Layering on Capacity Assessment 5/10/01 Probabilistically generated Frio-like heterogeneity
Planning Planning 1 2
Simple Characterization for Proposal Modeling used to select well spacing, unit thickness, and amount of CO2 needed
Using Modeling for Planning • Pressure increase within regulatory limits • permeability, injection rate, outer boundary conditions • CO2 arrival at observation well • amount of CO2 injected, thickness of injection interval, well separation • Affordable duration of field test • injection rate, thickness of injection interval, well separation
Predictive Modeling 1 2 Predictive modeling
- Exported to numerical model Reservoir Model Fault planes Porosity Monitoring well Injection well 100m 500 m Monitoring injection and monitoring
Predictive Modeling to Obtain Project Objectives • Sensitivity analysis • Interaction of uncertainty in data, uncertainty in model parameter selection, and uncertainty in results • Tool selection (Planning = hypothesis of tool success in detecting expected conditions) • Seismic, EM, Saturation logs • Propose testable hypotheses • Saturation history resulting from predicted residual saturation; timing of breakthrough, geochemical processes
Will CO2 arrive?Experimental design interaction with geologic uncertainties 2/2/03
Predicted Saturation for History Match –Sensitivity to Residual Saturation Case 1 Slr=0.30; Sgr=0.05 Case 2; Slr varies, ~ 0.10, Sgr varies, ~0.25 TOUGH2 model
Aquifer wells (4) Downhole P&T Final Design Monitoring Program at Frio Pilot Gas wells Access tubes, gas sampling Downhole sampling U-tube Gas lift Wireline logging Radial VSP Cross well Seismic, EM Tracers
P-Wave P-Wave S-wave Models Used to Design Pre-Injection Geophysics VSP - Designed for monitoring and imaging - 8 Explosive Shot Points (100 – 1500 m offsets) - 80 – 240 3C Sensors (1.5 – 7.5 m spacing) Reflection Denser spacing in reservoir interval Cross Well -Designed for monitoring and CO2 saturation estimation - P and S Seismic and EM - > 75 m coverage @ 1.5 m Spacing (orbital-vibrator seismic source, 3C geophone sensor) - Dual Frequency E.M. Tom Daley, LBNL: Paulsson Geophysical
Hypothesis: Residual Saturation Controls Permanence and can be measured during experiment Residual gas saturation of 5% • Modeling has identified variables which appear to control CO2 injection and post injection migration. • Measurements made over a short time frame and small distance will confirm the correct value for these variables • Better conceptualized and calibrated models will be used to develop larger scale longer time frame injections Residual gas saturation of 30% TOUGH2 simulations C. Doughty LBNL
Modeled Long-term Fate - 30 years Predicted significant phase trapping Minimal Phase trapping
Observed Saturation Distribution Through Time-Injection Well Borehole correction Sigma Borehole salinity: run 1 high, run 5&6 fresh water 6 run: pressure gradient in borehole: water gradient Elapsed days 4 10 0 144 66 Run 5&6: constant temperature
Observed Saturation Distribution Through Time- Injection Well Perforations Change in saturation S.Sakurai, BEG
Calibration of Models 1 2 Calibration
Calibration of Models • Correctness of assumptions • Synergy of results from several tools • Seismic/saturation logs/hydrologic tests • Test hypotheses • Saturation history resulting from predicted residual saturation; timing of breakthrough, geochemical processes
Model Calibration with Observed Data Christine Doughty, Barry Freifeld, LBLN
Monitoring Well Sampling • Hourly samples delineated the arrival and characteristic of the CO2 breakthrough. • Sample gas composition was monitored in real time using a quadrupole • mass spectrometer. Barry Freifeld LBNL
Modeling During Project Essential to Frio Project Objectives • Project Goal: Early success in a high-permeability, high-volume sandstone representative of a broad area that is an ultimate target for large-volume sequestration. • Demonstrate that CO2 can be injected into a brine formation without adverse health, safety, or environmental effects • Determine the subsurface distribution of injected CO2 using diverse monitoring technologies • Demonstrate validity of models • Develop experience necessary for success of large-scale CO2 injection experiments
More information: Gulf Coast Carbon CenterFrio Pilot Log www.gulfcoastcarbon.org