Download

1 / 18
180 likes | 333 Views
Projections & Coordinate Systems. James Payne Morongo Band of Mission Indians. Some definitions…. Coordinates: at least 2 values that together define where a point is: 12 th Avenue and Main Street 34.2942 N 116.2303 W

E N D
Projections & Coordinate Systems James Payne Morongo Band of Mission Indians
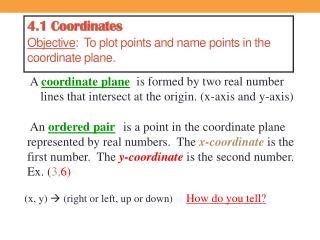
Some definitions… • Coordinates: at least 2 values that together define where a point is: • 12th Avenue and Main Street • 34.2942 N 116.2303 W • Coordinate system: the rules that define how coordinates are placed and viewed • Where the “starting point” is • Provides values for measurements
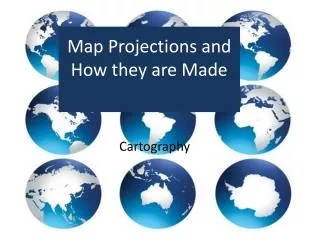
Some definitions… • Projection: a method for displaying 2-dimensional maps (paper, monitor) • Dependent on area of interest and scale • Datum: a framework or model for measuring locations on the earth • Different representations of the shape of the earth provide different “views”
Some details… • A coordinate system uses a 3-dimensional sphere to define locations • This is based off of a model (the datum)
Some details… • The projection presents that 3-dimensional information • All projections are based on a coordinate system • Every map projection distorts distance, area, shape, direction, or some combination thereof • Imagine taking an orange, peeling it, and trying to flatten the peel – it will rip
Coordinate Systems Visualized Image from ESRI
Projections Visualized Conic Planar Cylindrical Images from ESRI
What does all this mean? • You choose a coordinate system based on your data • You choose a projection that will best represent your area of interest Some examples….
The points represent the same information, they are just shown in different views
Receiving data • Find out the coordinate/projection • ArcMap will “reproject on-the-fly”, meaning it knows how to display data in one coordinate system to look proper in another, but may present issues • If receiving/providing coordinate data, need to know the datum to which it relates
These points have the same coordinate values, but are shown by differing coordinate systems (which are based off of different datums).
What to use? • Look at where you will be obtaining data from • What projection (with its associated coordinate system) is it in? • Using the “predominant” one may increase productivity time but • Are you happy with the display for your area? • If not, you can reproject it to fit your needs • What do other users in your area use?
ArcMap automatically assumes the coordinate system of the map based off of the first layer added UNLESS it is previously set • A common warning when adding data in a coordinate system that is different from the map • Reproject on-the-fly
Summary • A coordinate system defines locations on earth • A projection converts data from the round earth onto a flat plane • Projections are designed for a specific purpose with different distortions
Summary • Most common datums used in North America are: • NAD 1927 • NAD 1983 • WGS 1984 • Know your data for proper display • Use the metadata information