Download
1 / 23
240 likes | 376 Views
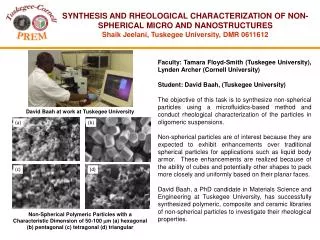
Optimization and validation of micro-CT for the characterization of non-bone porous materials. Kerckhofs Greet , Schrooten J., Van Cleynenbreugel T., Lomov SV., Wevers M. Katholieke Universiteit Leuven. Introduction. Ti bone scaffolds. HA bone scaffolds. Complex bone fractures

E N D
Optimization and validation of micro-CT for the characterization of non-bone porous materials Kerckhofs Greet, Schrooten J., Van Cleynenbreugel T., Lomov SV., Wevers M. Katholieke Universiteit Leuven
Introduction Ti bone scaffolds HA bone scaffolds Complex bone fractures • Reconstruction • Regeneration Polymer bone scaffolds
Introduction • Bone scaffolds design: pore size between 40 en 200µm, mechanical properties (stress and strain), biocompatibility, etc. • For quantifying the microstructure and the mechanical properties of bone scaffolds in a non-destructive way = high throughput screening of the design Micro-CT
Introduction Current problems with micro-CT: - Acquisition parameters by ‘trial and error’ - No quantitative validation criteria for non-bone porous materials - No protocol for image processing and analysis Experimental protocol for the optimisation and validation of micro-CT
Overview • Materials • Optimisation of micro-CT • Validation of micro-CT • Work in progress
Materials Ceramic bone scaffolds Metal bone scaffolds Polymeric bone scaffolds
Overview • Materials • Optimisation of micro-CT • Validation of micro-CT • Work in progress
µCT-simulator Micro-CT device Optimisation of the acquisition: µCT simulator Sample material Current? Voltage? Filter? Source Detector Optimal images???? Optimal images!!!! Objectively determined, ‘optimal’ acquisition parameters
Overview • Materials • Optimisation of micro-CT • Validation of micro-CT • Work in progress
Image registration, binarization and overlay Overlay image Sliced parts Optical image Full scaffold ≠ Micro-CT scanning angle Physical slicing angle Micro-CT image interpolation Interpolated micro-CT image Micro-CT image dataset Validation: micro-CT vs. optical light microscopy Slicing Philips HOMX 161 X-ray system with AEA Tomohawk CT-software Full scaffold micro-CT dataset
Experimental protocol Interpolation of the micro-CT image Finding the corresponding micro-CT image in the dataset
Image registration, binarization and overlay Overlay image Sliced parts Optical image Full scaffold ≠ Micro-CT scanning angle Physical slicing angle Micro-CT image interpolation Interpolated micro-CT image Micro-CT image dataset Validation: micro-CT vs. optical light microscopy Slicing Philips HOMX 161 X-ray system with AEA Tomohawk CT-software Full scaffold micro-CT dataset
Optical image Micro-CT image Matching • Automatic image registration (F. Maes - KULeuven) • Result = overlapping binarized images • Overlap = total green / (total blue + green) • Micro-CTmismatch = total red / (total blue + green) • Opticalmismatch = total blue / (total blue + green) Micro-CT Overlap Optical
Thresholding method Overlap and mismatch: influence of threshold Too high threshold Too low threshold
Thresholding method Overlap and mismatch: influence of threshold 89.6 % overlap 45.1 % micro-CT mismatch 10.4 % optical mismatch Best threshold Reference threshold
Results for Ti bone scaffolds 36 optical and their corresponding, interpolated micro-CT images Optimal threshold = 112
Limits of the micro-CT device Limited field of view Large sample dimensions Complex structure of the sample Material of the sample Results for Ti bone scaffolds 36 optical and their corresponding, interpolated micro-CT images 82.7 ± 4.54 % mean overlap + 43.8 ± 9.63 % micro-CT mismatch 17.3 ± 4.39 % optical mismatch AND… … influence of the threshold is significant!!!!!!!
Results for Ti bone scaffolds Influence of the threshold on the surface fraction (2D) Linear model predicts an increase of 2.6 % for a decrease of 5 % in threshold!!!
Overview • Materials • Optimisation of micro-CT • Validation of micro-CT • Work in progress
Work in progress Pixel size = 13.2 µm Micro-CT High-resolution micro-CT Optical light microscopy Pixel size = 3.7 µm
Work in progress Binning on the detector Binning of the reconstructed images Changing resolution Structural analysis Changing magnification Micro-CT measurements Different device Changing threshold Cfr. Validation protocol Optical light microscopy Hg porosimetry Pore size distribution Physical measurements Structural analysis He pycnometry % open and closed porosity