Download

1 / 28
550 likes | 1.07k Views
Mechanical Characterization of Materials. Aim and the Objectives. Aim: To understand why characterization of materials is important and required. And how the outcome of this can help us to improve the materials properties and develop new materials Objectives:

E N D
Aim and the Objectives • Aim:To understand why characterization of materials is important and required. And how the outcome of this can help us to improve the materials properties and develop new materials • Objectives: • Understand and differentiate between different testing methods, • Underline and discuss why different materials require different testing methods, • To be able to evaluate pros and cons of each method and design own method for a particular need.
Commonly Used Mechanical Testing Techniques Plus Effect of temperature and environment
What is Mechanical Testing: To understand and describe how materials deform (elongate, compress, twist) or break as a function of • applied load, • time, • temperature and other conditions, standard test methods and standard language (terminology) are needed. • If we can identify how damage initiates and propagates within the structure, we can improve the structure through processing and therefore develop new materials.
Tension Testing • The tension test is commonly employed to determine: • Young’s modulus (E), • Yield strength (sy), • Ultimate Tensile Strength (UTS), • Percent elongation (%EL) • Percent reduction of area (%AR). Specimens are usually round or flat s = P/A0 where A0 is the original cross-sectional area in the gage section, and P is the applied load. Fig. 1. Tensile specimens.
Testing machine: The testing machine is (generally) a screw-operated tension–compression machine with a movable upper crosshead and a fixed lower base (Fig. 2). A load cell in series with one of the grips is used to monitor the load P on the specimen. Fig. 2. Tension machine.
Extensometer: A displacement-measuring device that is attached directly to the specimen in its gage length, is used to determine the • axial strain • = Dllll0 • where l0 is the original length and lis the current length. • Strain Gauges: Strain on the specimen can be measured with strain gauges. • These devices use changes in • resistance, • inductance • capacitance to produce an electrical signal proportional to strain. Strain gauge is attached to the surface using glue therefore both sample and the gauge deform equally. Fig. 3.a. Extensometer. Fig. 3.b. Strain gauge
Typical stress–strain curves • For all materials, the slope E of the linear portion of the stress–strain curve for small strain is a characteristic of the material, called Young’s modulus. E= 200 GPa (steel) E= 70 GPa (aluminum) • Young’s modulus is an example of a bulk property of a material which is determined primarily by the major constituent of the material. Modulus for steel is about 190–200 GPa regardless of the alloy, cold working or heat treatment. • All materials have an ultimate strength given by su= Pmax/A0 where Pmax is the maximum load sustained in tension, and A0 is the original cross-sectional area. • Unlike Young’s modulus the ultimate strength depends strongly on alloy content and processing variables. Materials, such as piano wire steel and spider webs (fibrous materials) have incredibly large ultimate strengths.
Strength versus Stiffness Strength is not the same thing as Stiffness. Stiffness (E), is concerned with how stiff, flexible, springy or floppy a material is. Strength is the force or stress needed to break a thing. A biscuit is stiff but weak, steel is stiff and strong, nylon is flexible but strong, raspberry jelly is flexible and weak. The two properties together describe a solid about as well as you can reasonably expect two figures to do Fig. 5. Strength vs. stiffness.
Brittle and Ductile Materials • For a brittle material, the stress–strain curve is linear almost to failure. Therefore the failure occurs before the yield strength is reached. Glass, high-strength steels, and some polymers as (PMMA) exhibit brittle behavior. • For a ductile material, there is a distinct yield point beyond which the stress grows very slowly (if at all) with strain. Fig. 4. Brittle vs. ductile behaviour.
Ductile materials will often neck prior to failure. The necking begins when the ultimate strength has been reached, at which point the stress begins to decrease with increasing strain. Prior to necking, the deformation is homogeneous, after necking the deformation is inhomogeneous. Fig. 7. Necking
Measures of ductility Two measures of ductility are used: Percent elongation and percent reduction of area. • Percent elongation (%EL) is the observed nominal strain at failure, expressed in percent: Fig. 8. Nonuniform strain in ductile failure. The original gage length and specimen diameter must be reported when giving this information, since the strain at failure is nonuniform • Percent reduction of area (%RA) is given by: Percent reduction of area is not dependent on original gage length or specimen diameter; for this reason, %RA is a preferred measure of ductility.
Compression Testing • A compression test is commonly employed to enhance data for materials that have been tested in tension, or to test materials that are difficult to test in tension, such as brittle ceramics, building materials. • Young’s modulus (E), • Yield strength (sy), and ultimate strength are usually determined. • Ductility properties, % EL and % RA are not measured as ductile material will not fail in compression. • Specimens are usually round or rectangular, and must be fairly short to avoid buckling. Fig. 9. Compression machine. Testing machine: Most tensile testing machines can be used to conduct tests in compression by moving the crosshead in the opposite direction. Tension grips are replaced by flat platens.
Extensometer: As in the tension test, an extensometer is used if any strain-dependent parameters, such as Young’s modulus and 0.2%-offset yield stress are sought. However, if only ultimate strength is sought, an extensometer is not needed. • Typical stress-strain curve: The behavior of a material in compression often differs from that of the same material in tension. For ductile metals, it is often observed that failure will not occur in compression • cast iron, which is extremely brittle in tension but is very ductile in compression. Fig. 10. Compression behaviour of ductile materials
Bending Properties of Materials Brittle materials, including most ceramics are difficult to test in tension because: • Stress concentrations in the fillet region tend to cause failures near the grip • Any misalignment of the axial load induces bending in addition to tension • In addition, many ceramics are difficult to machine therefore the cost of producing dog bone-shaped specimens for tensile testing can be prohibitive. Fig. 11. Tension and compression stresses arise due to misalignment of the sample
3- and 4-point bending tests are developed for the brittle materials. • Problems of gripping are minimized as the stresses are primarily compressive in the regions of contact with the load and support rollers (brittle materials are usually relatively strong in compression). • Maximum tensile stresses are developed along only one edge of the specimen, and failure usually initiates at the surface in this region. • in the 3-point bending test, the maximum tensile stress occurs at only one line along this edge (perpendicular to the plane of loading), • in the 4-point bending test, the maximum tensile stress occurs over an area along this edge 3 point bending 4 point bending Fig. 12. 3 and 4 point bending test configuration Bending test will result in a higher strength than that measured from a tensile test,
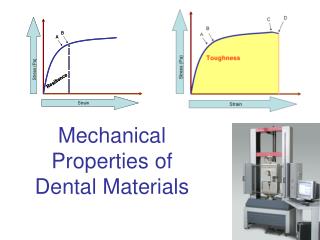
Toughness Toughness = the ability to absorb energy up to fracture Total amount of energy absorption can be calculated by the total area under the strain-stress curve up to fracture Fig. 13. Brittle versus ductile failure
Notch Toughness TestingCharpy and Izod • To test fracture characteristics of isotropic materials under high strain rates • Two standard tests, the Charpy and Izod, measure the impact energy (the energy required to fracture a test piece under an impact load), also called the notch toughness.
Impact resistance of the material is measured by the movement of the pendulum after the impact. • From the mass of the pendulum and difference between the released and final heights energy absorption can be calculated • Greater swing of the pendulum after impact, smaller the energy absorbed • As temperature decreases a ductile material becomes brittle. • Alloying usually increases the ductile-to-brittle transition temperature. • FCC metals remain ductile down to very low • temperatures. • For ceramics, this type of transition occurs • at much higher temperatures than for metals.
Release mechanism Impactor Impact support boundary conditions Velocity measurement& anti-multiple strike Specimen In- Plane Impact (Drop Impact) Testing Drop impact test is employed to assess the impact performance of the composites (anisotrophic materials). A projectile is dropped onto a plate type specimen. The mass and the height of the impact is kept constant. • Data is produced from force/ time and force/ displacement curves. • Most easily identifiable parameters are • Peak Force (Fmax), • Total Energy absorbed (E), • Velocity, • Deformation.
Fracture Toughness • For every material has specific critical stress intensity factor • of which if • KI<KIC the crack is stable and will not grow, • KI=KIC the crack will grow and in most cases the crack growth is catastrophic. • KIC can be calculated by loading the compact tension samples to failure under Pmax, The crack opening displacement is also monitored. Stress intensity factor at the sharp crack (notch)
Fatigue:Failure under fluctuating / cyclic stresses • Fatigue is a process of initiation and propagation of cracks in a material due to alternating loading. • Under fluctuating / cyclic stresses, failure can occur at loads considerably lower than tensile or yield strengths of material under a static load. • Estimated to causes 90% of all failures of metallic structures (bridges, aircraft, machine components, etc.)
Applied stresses causing fatigue may be: • axial (tension or compression), • flextural (bending), • torsional (twisting). (Mean Stress) (Range of stress) (Stress amplitude) (Stress ratio)
S/Ncurves: stress-number of cycles to failure Result of the cyclic test is commonly plotted as s (stress) vs. N (number of cycles to failure) • Low cycle fatigue: high loads, plastic and elastic deformation • High cycle fatigue: low loads, elastic deformation (N >105) Fatigue limit (endurance limit) occurs for some materials, such as Fe and Ti allows. In this case, the S-N curve becomes horizontal at large N. The fatigue limit is a maximum stress amplitude below which the material never fails, no matter how large the number of cycles is.
In most alloys, s decreases continuously with N. In this cases the fatigue properties are described by: Fatigue strength: stress at which fracture occurs after specified number of cycles (e.g. 107) Fatigue life: Number of cycles to fail at specified stress level Note that hundreds of fatigue tests on a given material must be conducted to give enough data to construct an accurate and statistically meaningful SN curve. Fatigue testing is therefore time consuming and expensive. Figure. Cyclic testing of car suspension component made from rubber and steel
Crack initiation and propagation Fatigue failure proceeds in three distinct stages: • Crack initiation: in the areas of stress concentration, • Crack propagation:Stage I: initial slow propagation along crystal planes with high resolved shear stress. Has flat fracture surfaceStage II: faster propagation perpendicular to the appliedstress. Crack grows by repetitive blunting and sharpening process at crack tip. Rough fracture surface. • Catastrophic failure.Nf = Ni + NpNf → Total number of cycles to failureNi → Number of cycles to initiate the crack • Np→Number of cycles to propagate the crack • Stress amplitude, mean stress, frequency and surface finish are important parameters that affect the fatigue life of a component.
Creep • Creepis the time-dependent strain that occurs in all materials at constant stress. • In metals and ceramics, creep becomes noticeable when the temperature reaches about 1/3 to 1/2 of melting temperature. • In polymers, creep becomes noticeable when the temperature approaches the glass-transition temperature. (which is near room temperature for many polymers) • Creep mechanisms (such as grain boundary diffusion, dislocation movements and bulk diffusion) give rise to permanent (plastic) strains. When the stress is removed, there will in general be some elastic recovery, but the material will not return to its original state. A typical strain v time graph of metal and ceramic. Secondary state is the most important as the rate increases rapidly. Several specimens are tested at different stress value to determine the effect of stress on the strain rate.
Then the strain rate is plotted as a function of stress to determine the dependence of the strain on stress (both axis in log scale) m gives the indication which creep mechanism is operating. • Stress Relaxation • In polymer materials the time dependent deformation is important (even at room temperature) due to their weak van der Waals inter-chain forces. • In stress relaxation test, the sample is tested at constant strain (extension) and materials response is measured in terms of decrease in the stress as a function of time.