Download
1 / 22
220 likes | 363 Views
Unit 2: Tools and Techniques of the Biologist. What we use and how we use it!. A. Scientific Method / Inquiry 1. Defining the ______________ What are you testing on what? ex: What is the effect of testing sugar on heart rate? 2. Formulating a ____________

E N D
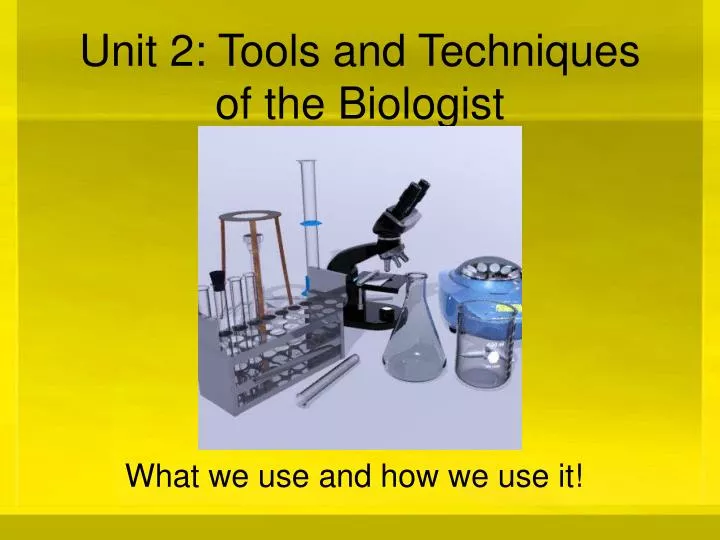
Unit 2: Tools and Techniques of the Biologist What we use and how we use it!
A. Scientific Method / Inquiry 1. Defining the ______________ What are you testing on what? ex: What is the effect of testing sugar on heart rate? 2. Formulating a ____________ “If…Then” statement ex: If sugar is given to a student, then their heart rate will increase If the _____________________ is changed, then the ___________________ will change Remember the hypothesis does not have to be correct – many great scientific discoveries have been made because the hypothesis was incorrect. What is important is that you write the hypothesis in the correct format. DO NOT use the words I, WE, or YOU.
3. Testing the Hypothesis, ___________________ a. Independent Variable The __________________ is the factor that the experimenter changes to see an effect b. Dependant Variable The __________________ is the factor that is affected by the independent variable c. Control The ________________ is the experimental setup without the independent variable The control offers a source of ____________ to see the effect d. Control Factors _________________ are other variable that are kept constant e. Reproducible Procedure To have a valid experiment the steps of the procedure have to be clear and understandable
ex: What is the effect of sugar on heart rate? a. Independent Variable Amount of sugar b. Dependant Variable Heart Rate c. Control The person not given sugar d. Control Factors Temperature, Exercise, Age, Gender, Type of Sugar e. Reproducible Procedure How much sugar? How do you measure heart rate? When do you measure the heart rate? Who are you measuring? How many people are you measuring? etc.
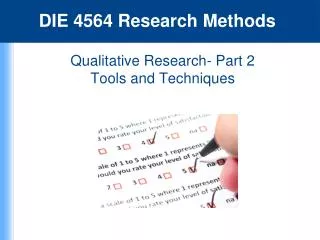
4. Observing and Measuring Observations are the data collect while doing the experiment Making graphs and charts to organize your data 5. Analyzing and Drawing Conclusion Inference are the ideas and reasoning based on the observation Conclusions relate back to the hypothesis to explain either why it happened or why it did not happen 6. Theories and Laws Every experiment can be made better by ______________ or __________ the _____________ With years of repeated testing with similar results theories and eventually laws can be developed
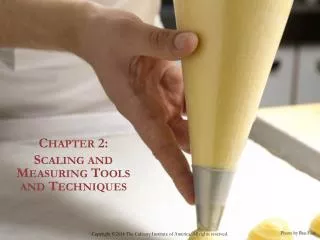
B. Measurements 1. SI Units = __________________ We use the metric system because it is based on _____ Converting units is much easier because all you have to do is move the decimal point. a. Length – ________, _______, ________, _________ 1 meter = _____ centimeters 1 centimeter = _____ millimeters 1 millimeter = ______ micrometers b. Mass – _________, _________ c. Volume – _________, ________, __________ (cc) d. Temperature - ___________
2.5cm = 25mm 2.5cm = 25mm 9cm = 90mm 6cm = 60mm 4.5cm = 45mm 373.4g 5ml 20ml 9ml 24ml 2ml 16ml -2C 49C 8C 70C -8C 42C
2. Graphing Graphing makes a picture of the data Graphing makes it easier to interpret the data and see general trends Making Graphs: 1. Label the axes. The x-axis should be labeled with the __________________ The y-axis should be labeled with the __________________ 2. Scale both axes. Each box has to represent the same amount. Start at zero and count by 2s, 5s, or even 10s. DON’T UST PUT THE NUMBERS THEY GIVE YOU! 3. Plot your points. Circle the points. Connect the points. 4. Title your graph. 5. Answer any questions based upon the graph.
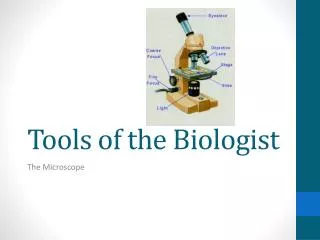
C. Equipment 1. Compound Light Microscopes a. __________ b. ________________ c. __________ d. ______________________ e. ____________ f. Mirror / Illuminator, Body, Stage, Base g. ________________ Total Mag = Ocular Mag x Objective Mag = 10 x 40 = 400 h. Resolution Resolution is the ability to distinguish between 2 different items
2. Other Types of Microscopes a. Simple - 1 lens = magnifying lens b. Stereo - use both eyes, 3D image, used for micro-dissections c. Electron Microscope – extremely high magnification and resolution
3. Centrifuge Centrifuges separate materials based on density by spinning very rapidly 4. Tissue Culture Tissue culture is the growth of cells in the lab
5. Chromatography Chromatography is the separation of pigments (colors) in a sample
5. Electrophoresis __________________ is the separation of DNA pieces using electricity. It make a DNA fingerprint specific pattern