Download
1 / 14
140 likes | 198 Views
Demography, continued. The Human Pyramids. Learning Goals:. We continue to investigate population characteristics. We are learning to construct and interpret population pyramids. Social Goal: active listening, mutual respect, participation, collaboration. Let’s review:.

E N D
Demography, continued. The Human Pyramids
Learning Goals: • We continue to investigate population characteristics. • We are learning to construct and interpret population pyramids. • Social Goal: active listening, mutual respect, participation, collaboration.
Let’s review: • Minds On: Think/ Pair/ Share what are population characteristics and what do they tell us? • Why do we need information about population characteristics? • Which parts of the world experience a very high increase in population?
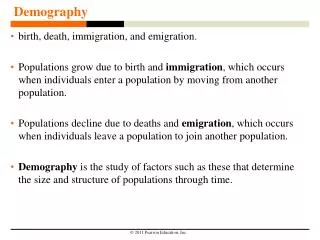
Do you remember how a population can change in a country? • It depends on a number of people who are born and die each year. • There is a natural increase when birth rate is higher than death rate. • There is a population decrease when the birth rate is lower than the death rate. • Another reason population changes is immigration. • The difference between the number of people leaving (emigrating) and those coming in (immigrating) is called the net migration.
Population Pyramids Population pyramids are a type of graph that give information about the number of people in each age group and the balance of males and females in a country’s population.
It’s a visual representation of male and female statistics together in one graph. Males graph Females Graph
The pyramid is divided down the middle to show males on the left and females on the right. The youngest people in a society are shown in the bars at the bottom of the graph. The oldest people are on the top. If you want to predict some of the things that will happen in a country, it helps to know about the age groups. If more people are young, then you must plan for the needs of children, for example education and health care.
A rapidly growing population like Kenya’s has a wide base at the bottom (a large number of young people) and a narrow top (not many older people). This type of population pyramid is typical of developing countries. A population pyramid that has a narrow base and fairly equal numbers of people in all age groups represent a more developed country. It is stable. What is happening in Germany?
Let’s look into the future. Comparing Kenya, Canada and Germany. 1950 - 2100
1950- 2100 Kenya’s population
It’s your turn to construct a population pyramid. Task 1: Constructing the population pyramid: working in pairs (A + B), you need two colours of markers, one pyramid sheet and one data sheet Person A: Tells the recorder the information Person B: Recorder Task 2: Interpret the results together, person A records the answers Task 3: Compare your resultswith the other pair at your table. How Canada and Bolivia’s population pyramid differ and how are they similar? Which of the two graphs shows a greater increase in total population? How governments may use this information to plan for the future needs of society?