Download
1 / 25

E N D
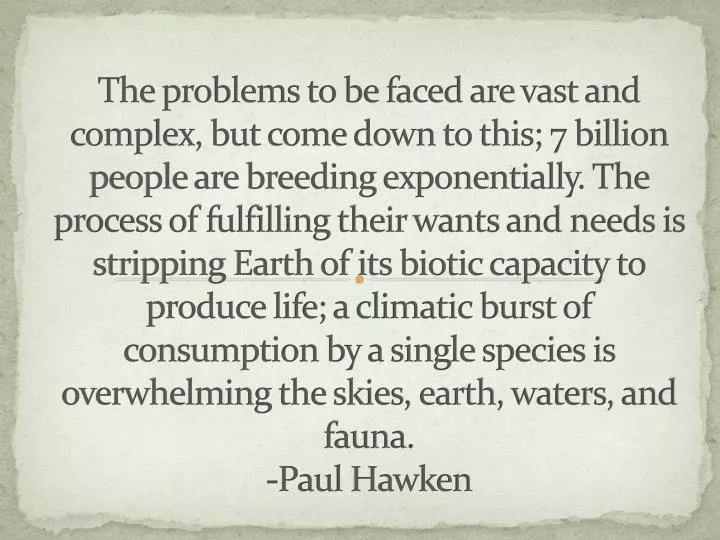
The problems to be faced are vast and complex, but come down to this; 7 billion people are breeding exponentially. The process of fulfilling their wants and needs is stripping Earth of its biotic capacity to produce life; a climatic burst of consumption by a single species is overwhelming the skies, earth, waters, and fauna.-Paul Hawken
Demography • The study of the size, composition, and distribution of human populations and the causes and consequences of changes in these characteristics is known as demography. • The changes in human populations can have an impact on health, social, economic, and environmental effects.
So what is happening with the world’s population? • Birthrates have come down but the population is still continuing to grow. • Deathrates have come down more than birthrates but we still continue to grow exponentially – with 97% of the new population being in developing countries.
Some stats: • World’s population growth dropped from 2.2% to 1.2% from 1963 to 2008. • BUT the population doubled: 3.2B – 6.7B • In 2008, 80M people were added to the planet (2.5 Canada’s!!) • Developed countries have a growth rate of 0.2% while developing countries have a growth rate of 1.5% - eight times faster! • Developing countries have 5.7B people and are expected to reach 8B by 2050 while developed countries will stay about the same at 1.2B • India, China, USA, Indonesia, Pakistan, and Nigeria are expected to have the highest growth rates.
Turn to page 184 and read the case study. • Thailand reduced its growth in only fifteen years. • 1971, 3.2% growth rate and it dropped to 0.8% in 1986. • 1) family planning through government • 2)literacy rates in women • 3) increased economic role for women • 4) better health care for women/children • 5) encouragement of contraceptives • 6) people involved had loans to add drinking water and toilets • 7) education and economic rewards for family planning • 8) great at lowering birthrate but has increased pollution • 9) not great public health • 10) poor air quality
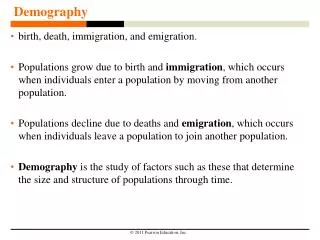
What affects population size? • Births, deaths, and migration. • Births + immigration = increase • Deaths + emigration = decrease
Are we growing exponentially? • YES!! – any birthrate that is above 1% grows exponentially over a period of time. It has slowed down but still grows.
World Population: 1963-2008 • The population has doubled but the birthrate has was almost cut in half. • 80,000,000 were added in 2008!
Developed vs. Developing • Developed countries have a birthrate of 0.2% whereas developing countries have a birthrate of 1.5%. • The population is much larger in developing countries therefore the populations are going to cause a global population to continue to increase.
Who grows the fastest? • India, China, USA, Indonesia, Pakistan, and Nigeria.
What was the population of China in 2008? Predicted 2025? • 1.3 billion – 1.5 billion • What was the population of India in 2008? Predicted 2025? • 1.1 billion – 1.4 billion • What was the population of Canada in 2008? Predicted 2025? • 33 million – 38 million
Rule of 70 • Used to calculate the doubling time of a population by using the percentage growth rate. • 70/1.2 = 58.3 years for Earth!
Five Factors that affect Birthrates • Cost for raising and educating children • Education and employment opportunities for women • Infant deaths • Marriage age • Availability of contraceptives and abortions
Factors that affect Deathrate • Availability of food • Better nutrition • Advances in medicine • Improved sanitation • Safer water supply … all in all… deathrates are declining due to technological advances and improved health care for individuals.
Immigration to Canada • From 1500-1700, 6 million immigrants moved to Canada. • From 1820-1900, 50 million Europeans immigrated to North America.
2031? • ¼ of Canadians will be over the age of 65.
Age Structure • By looking at populations of young, middle, and older age groups this can determine how fast a population can grow. • If you have a population that is older than majority the population cannot grow as they have past the reproductive stages. • If they are too young, it won’t grow but will eventually hit a massive reproduction phase • If they are in the middle, they are right at the time of reproduction.
World Population Statistic • 28% of the world’s population in 2008 were under the age of 15…. What is going to happen?!!? • http://www.youtube.com/watch?v=LF15YAvT9G0&feature=related
India’s attempt to reduce population growth • Continues to grow and is expected to surpass China – has currently 17% of world’s population • Poverty • Malnutrition • Environmental problems – degraded forests, soil resources, waterlogging, salinization, overgrazing, and deforestation • 2/3 of water is polluted and sanitation is inadequate • Family planning: poor planning, bureaucratic ineffeciency, the low status of women, extreme poverty, and lack of administrative and financial support. • Families feel they need more children to help bring money into the home and care for them in old age • Need for a male heir