Download

1 / 66
670 likes | 709 Views
Demography. Dr. Sireen M. Alkhaldi Department of Family and Community Medicine Community Medicine Course 2018/2019 Faculty of Medicine/ The University of Jordan. Lecture Objectives. Present the need for population studies ( demography)

E N D
Demography Dr. Sireen M. Alkhaldi Department of Family and Community Medicine Community Medicine Course 2018/2019 Faculty of Medicine/ The University of Jordan
Lecture Objectives • Present the need for population studies ( demography) • Introduce the components of population dynamics ( births, deaths, migration) • Introduce the basics of fertility and mortality and their measures • Discuss determinants of fertility • Describe population composition • Describe types of population profiles • Introduce basics of population change • Introduce basics of population transition
Resources: • Population Handbook, 6th International Edition, 2011. • Jordan Population and Family Health Survey for the years 2017/18.
Demography Demography ( population studies): is the study of human populations: their size, composition, and distribution as well as the causes and consequences of changes in these characteristics.
Demography • Everyone of us is a member of a population. • Population factors have an impact on many facets of life—from where we live to the prices we pay for goods and services. • The need for health care preoccupies the political leaders of the industrialized countries whose populations are “aging,” while the need for classrooms, employment opportunities, and housing preoccupies the leaders of countries that are still growing rapidly.
Demography • Demography is the scientific study of population. • Demographers seek to know the levels and trends in population size and its components. They search for explanations of demographic change and their implications for societies. • They use censuses, birth and death records, surveys, visa records, even motor vehicle and school registrations. They shape these data into manageable forms such as simple counts, rates, or ratios. • Most of the principal measures used in demography (counts, rates, ratios, and proportions) will be defined in these lectures, together with recent examples of their use.
The Tools of Demography • COUNT: The absolute number of a population or any demographic event occurring in a specified area in a specified time period. (For example, 2,027,000 live births occurred in Egypt in 2010.). • RATE: The frequency of demographic events in a population during a specified time period (usually a year) divided by the population “at risk” of the event occurring during that time period. Rates tell how common it is for a given event to occur. (For example, in 2008 in Zambia the death rate was 16 per 1,000 population.) Most rates are expressed per 1,000 population. Crude rates are rates computed for an entire population and Specific rates are computed for a subgroup, usually the population more nearly approximating the population “at risk” of the event (age-specific, sex-specific, race-specific, occupation-specific)
The Tools of Demography • RATIO: The relation of one population subgroup to or to another subgroup; that is, one subgroup divided by another. (For example, the sex ratio in France in 2010 was 94 males per 100 females.) • PROPORTION:The relation of a population subgroup to the entire population; that is, a population subgroup divided by the entire population. (For example, the proportion of Vietnam’s population in 2008 classified as urban was 29 percent.)
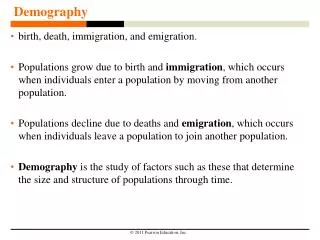
Demography: Population Dynamics Three major factors determine the dynamics of a population: • Births ( fertility) • Deaths ( mortality) • Migration If some groups within a population grow or decline faster than others, the composition of the whole is altered. These three factors determine the most basic characteristics of a population, as well as its demographic future.
Fertility Fertility is the number of live births women have. • Total Fertility Rate (TFR): is the average number of children that would be born to a woman by the time she ends childbearing. • The TFR is one of the most useful indicators of fertility because it gives the best picture of how many children women are currently having. • The average for the world it is 2.42 (2016) • In Jordan total fertility rate is 2.7 (JPHS, 2017/18).
Source: Jordan Population and Family Health Survey 2017/2018 https://dhsprogram.com/pubs/pdf/PR106/PR106.pdf
Source: Jordan Population and Family Health Survey 2017/2018 • https://dhsprogram.com/pubs/pdf/PR106/PR106.pdf
Trends in Total Fertility Rate 1900-2017 Births per woman
Fecundity The physiological ability of women to reproduce. • Some are infecund due to disease or genetic dysfunction. • Mothers could be infecund when they breastfeed. • For individuals, fecundity ranges between 0-30 children.
Factors Affecting fertility What are the factors that may influence fertility? Cultural, social, economic, and health factors interfere with the process of human reproduction. • These factors operate in different societies in different ways. The relative importance of these factors varies by society. These factors are: • General factors • Specific factors (proximate determinants)
Factors Affecting fertility (general factors): • Cultural values e.g. ( Does the society value large or small families?) • Social roles: ( Is the wife primarily a child bearer or a child rearer ?) • Economic ( Do parents rely on children to look after them in old age?) • Health ( what is the prevalence of gonorrehea in a population ), that will impair fecundity.
Proximate determinants of fertility Fertility is affected by cultural, social, economic, and health factors. Most of these factors operate (indirectly) through 4 other factors which explain nearly all variation in fertility levels among populations and have a direct biological effect on fertility: • The proportion of women in sexual union. • The percentage of women using contraception • The proportion of women who are not currently fecund (primarily because of breastfeeding). • The level of induced abortion.
Proximate determinants of fertility • In US. and most developed countries contraceptive use and abortion are the most important proximate determinants. The US, Brazil, Australia, and few East and South East Asia countries have contraceptive use rates of >= 75%. • The latest figure in Jordan is 42% for modern methods use( DHS report, 2012).
Proximate determinants of fertility • Spain recorded the lowest fertility rate in a nation 1.15 births per woman of reproductive age. Basically due to 72% using contraceptives. • Russiaachieved low fertility rates due to having easier access to abortion.
Proximate determinants • When contraceptive and abortion prevalence rates are low, the postpartum infecundity and marriage determinants are more important. • African countries: women marry early and bring more children, but they breast feed for 2-3 years, thus prolonging the period of infecundity following childbirth.
Fertility Measurement Birth Rate (Crude Birth Rate) • The birth rate (also called the crude birth rate) indicates the number of live births per 1,000 population in a given year • It is the most easily obtained and most common reported fertility measure
Fertility Measurement Crude Birth Rate • There were 24 births per 1,000 population in Kuwait in 1994 : Number of births (38,868) divided by the Total population (1,620,086 ) x K (1,000 )= 24.0 • In Jordan, Crude Birth Rate= 28.1 (DHS 2012).
Fertility Measurement General Fertility Rate • The general fertility rate GFR, (also called the fertility rate) ,is the number of live births per 1,000 women ages 15-49 in a given year. • The GFR is a somewhat more refined measure than the birth rate because it relates births to the age-sex group at risk of giving birth (usually defined as women ages 15-49).
General Fertility Rate • Yemen’s general fertility rate in theearly 1990s was 238 live births per 1,000 women ages 15-49—one of the highest in the world. • The Czech Republic’s, it was very low at a rate of 34 per 1,000 women aged 15-49 in 1996.
Replacement level fertility • The level of fertility at which a couple has only enough children to replace themselves, or about two children per couple. • This pop will eventually stop growing. • It needs a TFR slightly higher than 2 • In US it is 2.1 because death rate is not too high • In Sierra Leone , Repl. Level Fert. would be greater than 3 because death rate is too high.
Mortality Death Rate • The death rate (also called the crude death rate) is the number of deaths per 1,000 population in a given year. • In the early 1990s, the death rate in Turkey was 6.6 per 1,000 population. Number of deaths (405,000 )/ Total population (61,644,000) x K (1,000) = 6.6 • In the early 1990s, Guinea’s death rate was 20 per 1,000 population, while Singapore’s was 5 per 1,000.
Death rates: • Age-Specific death rate • Cause-specific death rate • Sex-specific death rate
Infant Mortality Rate (IMR) The infant mortality rate is the number of deaths of infants under age 1 per 1,000 live births in a given year. The infant mortality rate is considered a good indicator of the health status of a population. • Latest figure about IMR in Jordan is 17/1000 live births ( DHS /2012)
Maternal Mortality Ratio • The maternal mortality ratio is the number of women who die as a result of complications of pregnancy or childbearing in a given year per 100,000 live births in that year. • Deaths due to complications of spontaneous or induced abortions are included. • a maternal death is defined as the death of a woman while pregnant or within 42 days of termination of pregnancy from any cause related to or aggravated by the pregnancy or its management but not from accidental or incidental causes.
Maternal Mortality Ratio • This measure is sometimes referred to as the maternal mortality rate • Number of maternal deaths (185 )x Total live births (1,408,159 )x K (100,000 )= 13.1 • In Jordan MMR 19.1 (Maternal Mortality Study – Jordan 2007-2008- Higher Population Council, 2009)
Morbidity • Morbidity refers to disease and illness, injury and disability, in a population. • Data about the frequency and distribution of a disease can aid in controlling its spread, and in some cases, may lead to identification of it causes.
Morbidity : Incidence Rate Incidence: The incidence rate is the number of people contracting a disease during a given time period per 1,000 population at risk. The incidence rate and other morbidity rates vary so widely in magnitude that any constant may be used that expresses the rate in a clear manner (from “per 100” or “percent” to “per 100,000”). Number of people developing tuberculosis during a given time period x K = 252,316 x 100,000 = 372 Population at risk 67,827,000 The incidence of tuberculosis in the Democratic Republic of the Congo in 2009 was 372 per 100,000 population
Morbidity (Prevalence) Prevalence: The prevalence rate is the number of people who have a particular disease at a given point in time per 1,000 population. This rate includes all known cases that have not resulted in death, cure, or remission, as well as new cases developing during the specified period. Number of people ages 15-49 with HIV/AIDS x K = 892,750 x 100 = 14.3 Total population ages 15-49 6,243,000 The prevalence of HIV/AIDS in Zimbabwe among adults (ages 15-49) in 2009 was 14.3 per 100 population. In 2009, the prevalence rate of HIV/AIDS for males ages 15-49 in Botswana was 20.6 percent and for females, 29.2. Corresponding rates in Argentina were 0.6 and 0.3, respectively.
Morbidity Case Fatality Rate The case fatality rate is the proportion of people contracting a disease who die of that disease during a specified time period. Number of persons dying from the disease x K = 12,270 x 100,000 = 20.5 Number of persons contracting the disease 60,000,000 during a period From April 2009 to March 2010, the U.S. Centers for Disease Control and Prevention estimates that there were 12,270 deaths from H1N1 flu in the United States, or 21 deaths for every 100,000 cases
Life Expectancy • Life expectancy is an estimate of the average number of additional years a person could expect to live if the age-specific death rates for a given year prevailed for the rest of his or her life. • Life expectancy is a hypothetical measure because it is based on current death rates and actual death rates change over the course of a person’s lifetime. • Each person’s life expectancy changes as he or she grows older and as mortality trends change.
Life Expectancy • If the age-specific death rates for 1996 remain unchanged, males in Brazil born in • Life expectancy for Jordanians 73 years (DHS, 2012).
Population CompositionAge and Sex Composition • Age and sex are the most basic characteristics of a population. • Every population has a different age and sex composition—the number and proportion of males and females in each age group— • This structure can have considerable impact on the population’s social and economic situation, both present and future.
Population CompositionAge and Sex Composition • Populations could be relatively young / developing countries, About 40 % <15 years e.g. Africa.. Jordan . Less than 4% are older groups. • Relatively old populations ( aging), developed countries, more than 10% over 65 years e.g. Europe/ Less than 25% of pop <15 years.
Age and Sex Composition • Young and old populations have markedly different age compositions; as a consequence, they also have different proportions of the population in the labor force or in school, as well as different medical needs, consumer preferences, and even crime patterns.
Median Age A population’s age structure has a great deal to do with how that population lives. • The median age is the age at which exactly half the population is older and half is younger. • Examples: The median age of the Costa Rican population in 1995 was 23 years. While that in Sweden was 38, signifying an older population. • In 1995, the median age in Jordan, with a young population, was 18. In 2012, median age in Jordan was 20,3 years (2012).
Sex Ratio • The sex ratio is the ratio of males to females in a given population, • usually expressed as the number of males for every 100 females. • The sex ratio at birth in most countries is about 105 or 106 males per 100 females. • After birth, sex ratios vary because of different patterns of mortality and migration for males and females within the population.
Population Pyramid • A population pyramid graphically displays a population’s age and sex composition. • Horizontal bars present the numbers or proportions of males and females in each age group. • The sum of all the age-sex groups in the population pyramid equals 100 percent of the population.
Population profiles • Populations of countries can differ markedly as a result of past and current patterns of fertility, mortality, and migration. However, they all tend to fall into three general profiles of age-sex composition. 1. Rapid growth is indicated by a pyramid with a large percentage of people in the younger ages. 2. Zero growth or decreasing is reflected by a pyramid with a smaller proportion of the population in the younger ages. 3. Slow growth populations are shown by roughly equal numbers of people in all age ranges, tapering off gradually at the older ages.