Download
1 / 12
160 likes | 606 Views
Demography. The increase of the world population*. Population histograms : ranking/country**. Population curves between Europe and Africa**. Resources * http://www.ined.fr/en/everything_about_population/animations/world_population/

E N D
Demography The increase of the world population* Population histograms : ranking/country** Population curves between Europe and Africa** Resources * http://www.ined.fr/en/everything_about_population/animations/world_population/ ** http://www.ined.fr/en/everything_about_population/population_atlas/
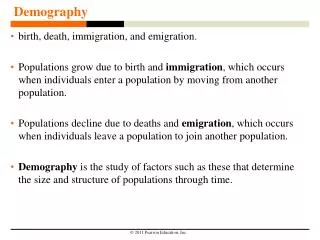
The increase of the world population Introduction In 1999, there were 6 billion people living on Earth, and by 2011 or 2012, the population will reach 7 billion. Why is the world population increasing so fast ? And what will happen in the future ? Population growth today World population history The demographic transition The future world population : explosion, implosion, or equilibrium ? Conclusion Next Back
The increase of the world population Population growth today Every second, on average, four babies are born. Every second, on average, two people die. Every second, on average, the population increased by two people. Two more people per second means 200 000 more people per day, and 75 million more people per year. In other words, the world population – 6,5 billion in 2005 – is growing by 1,2 percent each year. At this 1,2 % annual growth rate, the population doubles evrey 60 years. If the number of people on Earth carried on increasing at this speed, the 6,5 billion in 2005 would become 13 billion in 2065, 26 billion in 2125 ans so on. But the population does not grow at the same speed indefinitely. On the contrary, the United Nations predict that the world population will level off at around 9 billion people before the end of the century. Why is that ? Back
The increase of the world population World population history World population increase in the last two thousand years Billions of inhabitants 0 500 1000 1500 2000 years Throughout most of human history, the number of people on Earth could be counted in just hundreds of thousands or in millions, and the population increased very slowly. Two thousand yeras ago, there were around 250 million people in the world, and by the end of the 18th century the total had reached one billion. At around that time, the population started growing much faster. From one billion in 1800, it rose to two billion in 1927, 3 billion in 1960, 4 billion in 1974, 5 billion in 1987 and 6 billion in 1999. Whe should reach 7 billion by around 2011 or 2012, and growth will not stop there. So what will happen next ? The United Nations are forecasting that the world population will level off at a mere » 9 billion by around 2050. How did they reach this figure ? And looking back in history, why did the population grow so slowly up to the eighteenth century ? Why did it start rising so fast from then on ? Back
The increase of the world population The demographic transition Back
The increase of the world population The future world population : explosion, implosion, or equilibrium ? World population projections to 2300 : scenario 1 Billions of inhabitants 1950 2000 2050 2100 2150 2200 2250 2300 years In the demographic transition model, fertility stabilizes at the remplacement level – two children per woman – when mortality is low. The United Nations have imagined a scenario in which future families each have exactly two children on average, in which case the world population would level off after reaching 9 billion. Next Back
The increase of the world population The future world population : explosion, implosion, or equilibrium ? World population projections to 2300 : scenario 2 Billions of inhabitants 1950 2000 2050 2100 2150 2200 2250 2300 years But in many countries where the demographic transition is complete, average fertility is well below 2 children per woman. For example, it was 1,5 in the countries of the European Union in 2005, and 1,3 in Japan. If very small families became a world-wide model over the long term, the world population would peak at 9 billion then start declining until human beings eventually died out altogether. Next Back
The increase of the world population The future world population : explosion, implosion, or equilibrium ? World population projections to 2300 : scenario 3 Billions of inhabitants 1950 2000 2050 2100 2150 2200 2250 2300 years Fertility may also start increasing again in the countries where it is currently very low, stabilizing at 2,3 children worlwide. This would result in continuous growth – up to 37 billion in 2300 – and here agaiun the ultimate disappearnce of the human race, this time due to overpopulation. Next Back
The increase of the world population The future world population : explosion, implosion, or equilibrium ? World population projections to 2300 : scenario 4 Billions of inhabitants 1950 2000 2050 2100 2150 2200 2250 2300 years Under the so-called « contant fertility » scenario, in which fertility remains at its current level for the next three centuries, the population would reach 134 000 billion in the year 2300 ! But this scenario is unrealistic, since fertility is decreasing throughout the world. It simply shows us how continuous growth leads to explosion within a very short time. These catastrophic scenarios, resulting in the extinction of the human race through implosion or explosion, are not the only alternatives. We need to imagine a return to equilibrium over the long term. The medium scenarios based on assumption that achieve a long-term balance, such as fertility of exactly two children per woman for example. It is no more realistic than the high or low scenarios, but simply shows what path needs to be followed if we to survive beyond the next few centuries. Back
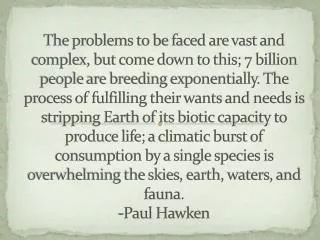
The increase of the world population Conclusion In 1999, Humankind is starting to control its population growth. But to ensure a decent standard of living for 9 billion people, we will need to manage the planet’s resources more efficiently and share them more equitably. Over the long term, the survival of the human race depends as much – if not more – upon our way of life as upon our number. Back
Population histograms : ranking/country 1950 2000 2050 Back
Population histograms : ranking/country billions billions 2 2 Population 1 1 1950 1975 2000 2025 2050 1950 1975 2000 2025 2050 8 8 Number of children per woman 4 4 1950 1975 2000 2025 2050 1950 1975 2000 2025 2050 millions millions 220 220 Population aged 65 and above 110 110 1950 1975 2000 2025 2050 1950 1975 2000 2025 2050 Back