Download
1 / 18
180 likes | 293 Views
Redd Surveys Casey Campos PSMFC. LOWER YUBA RIVER ACCORD Monitoring and Evaluation Program. Redd Survey Presentation. Overview. 2008-2009 Pilot Redd Survey Index-Area Survey, Extensive-Area Survey, Aerial Survey Lessons Learned From the Pilot Survey Analysis of Pilot Survey Data

E N D
Redd Surveys Casey Campos PSMFC LOWER YUBA RIVER ACCORDMonitoring and Evaluation Program
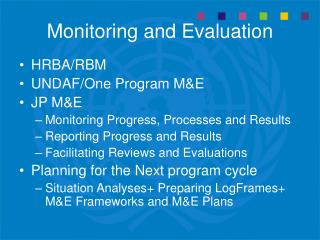
Redd Survey Presentation Overview • 2008-2009 Pilot Redd Survey • Index-Area Survey, Extensive-Area Survey, Aerial Survey • Lessons Learned From the Pilot Survey • Analysis of Pilot Survey Data • Overview of 2009-2010 Redd Survey Protocols • Preliminary Results from 2009-2010 Redd Survey
Index-Area Redd Survey Redd Attributes Level of Superimposition Spawning Periodicities of Differing Runs 2008-2009 Pilot Redd Survey Index-Area Site
2008-2009 Pilot Redd Survey Extensive-Area Redd Survey • Monthly River Surveys • Spatial and Temporal Redd Distribution throughout the spawning season
Aerial Redd Survey Entire River Survey Spatial and Temporal Redd Distribution Lasting Record of Redd Distribution 2008-2009 Pilot Redd Survey
Lessons Learned from Pilot Redd Survey Aerial Redd Survey • More redds observed during extensive survey • Sun glare on riffles • Inability to distinguish individual redds from photos • Discontinued after first flight
Lessons Learned from Pilot Redd Survey Index-Area Survey • Tracking superimposition and obtaining physical redd attributes • Impossible to use to describe spawning distribution throughout all reaches of the lower Yuba River
Lessons Learned from Pilot Redd Survey Extensive-Area Survey • Identified as the most appropriate means of collecting a long term data set • Monthly frequency used during the Pilot Year was inadequate for addressing M&E Plan analytics
Analysis of Pilot Redd Survey Data • Robust Analysis of Pilot Data completed by HDR • Index area redd counts were fit to a statistical model of the assumed “true” redd distribution • A simulation approach was used to compare the effects of sampling frequency on data collection • Sampling frequencies of weekly, bi-weekly, tri-weekly and monthly were investigated • Estimated redd counts were then generated for each of the sampling frequencies and compared to the index area’s estimated redd counts Comparison of the number of Chinook salmon redds counted during the Index-Area survey and the number of redds predicted by the fitted statistical model. R2 indicates the coefficient of determination, and MSE is the mean square error of the fit.
Conclusions From Pilot Data Analysis • Sampling frequency affects • Estimated redd abundance • Estimates of spawning timing • Evaluation of the correct number of spawning runs • Weekly sampling frequency provides the most precise and least biased estimates of spawning abundance
Overview of 2009-2010 and Long-Term Redd Survey • Weekly extensive-area redd surveys August to May • Surveys now including the Englebright Reach • Systematic sampling of every 17th redd for physical measurements • Newly constructed redds marked to avoid double counts • Data dictionary added to GPS units to increase data collection efficiency
Preliminary ResultsSpatial/Temporal Distribution of Chinook Salmon • Initiation of spawning occurs in the upper reaches…distribution moves downriver • Suggests some separation of spring-run and fall/late fall-run salmon
Preliminary ResultsSpatial/Temporal Density of Chinook Salmon Redds • Density of Chinook Salmon Redds moves downriver over time
Preliminary ResultsChinook Salmon Redd Density • Highest density of Chinook salmon redds occurs above Hwy. 20 • Above State Route 20 (4 River Miles); Between State Route 20 and Daguerre (7 River Miles); Below Daguerre (10 River Miles)
Lower Yuba River Redds Appearing by Week Englebright Reservoir No survey Narrows Pool Timbuctoo Hwy 20 Bridge Daguerre Point Dam Feather River RST site Dec. 28, 2009 – Jan. 1, 2010 March 29 – April 2, 2010 Sept. 28 – Oct. 2, 2009 March 22 – 26, 2010 Sept. 14 – 18, 2009 Nov. 30 – Dec. 4, 2009 Oct. 26 – 30, 2009 Jan 18 – 22, 2010 Sept. 7 – 11, 2009 Sept. 21 – 25, 2009 March 8 – 12, 2010 March 15 – 19, 2010 Nov. 16 – 20, 2009 Oct. 19 – 23, 2009 March 1 – 5, 2010 Nov. 23 – 27, 2009 Oct. 12 – 16, 2009 Jan 25 – 29, 2010 Jan. 11 – 15, 2010 Feb. 15 – 19, 2010 Feb. 22 – 26, 2010 Dec. 14 – 18, 2009 Nov. 9 – 13, 2009 Jan. 4 – 8, 2010 Nov. 2 – 6, 2009 Oct. 5 – 9, 2009 Feb 8 – 10, 2010 Dec. 7 – 11, 2009 April 5 – 9, 2010 Dec. 21 – 25, 2009 Feb 1 – 5, 2010 Simpson Lane Bridge Prepared by Leslie Alber
Preliminary ResultsSpatial/Temporal Distribution of Steelhead Trout • Steelhead trout observed spawning near the end of December, peak spawning at the end of March • Highest density and number of Steelhead trout redds observed above Route 20
Next Steps • Identification of our long-term redd monitoring study design! • One completed year of data collection • Determine what effects Accord flows and temperatures have on the spawning distribution of salmonids in the lower Yuba River • High resolution mapping and modeling inputs will greatly enhance our ability to determine flow and temperature effects on the distribution of spawning salmonids
Thank You for Coming • Special Thanks to: • Lower Yuba River PSMFC Staff • River Management Team Members • California Department of Fish and Game • Pacific States Marine Fisheries Commission