Download
1 / 24
240 likes | 363 Views
Seasonal Evaluation of Lake Effect Snow Forecasts from High Resolution WRF Simulations Sensitivity to Microphysics, Lake Surface Temperatures and Ice Concentration. Justin Arnott – SOO, NWS Gaylord, MI Andrew M olthan – NASA SPoRT Jonathan Case – NASA SPoRT.

E N D
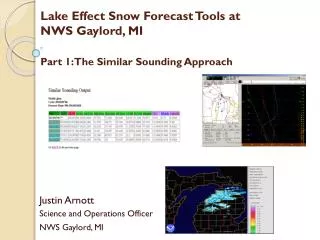
Seasonal Evaluation of Lake Effect Snow Forecasts from High Resolution WRF SimulationsSensitivity to Microphysics, Lake Surface Temperatures and Ice Concentration Justin Arnott – SOO, NWS Gaylord, MI Andrew Molthan – NASA SPoRT Jonathan Case – NASA SPoRT
Ongoing NWS/NASA SPoRT Collaboration • Operational Goal: Improve forecasts of Lake Effect Snow • Increase accuracy/detail of band timing/placement • Study Goal: Optimize Local WRF for LES Forecasts • Methods: • Seasonal verification of “bulk variables” • Case studies of particular events • Symbiotic Resource Exchange: • NASA provides additional computational resources • NWS provides platform to examine SPoRT Products
2010-2011 Results - Summary • Seasonal Comparison • NASA SPoRT vs. NCEP SSTs/Ice Coverage • Seasonal Verification • MaxT/MinT/Liquid Precipitation • vs NWS COOPs
2010-2011 Results - Summary • SPoRT data indicated greater ice coverage, warmer SSTs • Local WRF simulations w/SPoRT data showed larger QPF • Precipitation climatology reasonably forecast • Minimum Temperature high bias • Over-prediction of precipitation amounts during intense LES bands • Further studies by NASA SPoRT for 20-21 January 2011 case study suggest Morrison microphysics may provide improved precipitation forecasts
2011-2012 Study Overview • Continue examination of NASA SPoRT SST/Ice vs legacy NCEP data • Update Operational Local WRF run at WFO Gaylord to Morrison Microphysics • Perform sensitivity of legacy WFO Gaylord simulation (2010-2011) with updated simulation for 2011-2012 • Examination Period: 12/08/2011-2/26/2012 • Only examine days with LES within WFO Gaylord forecast area • 26 days included
2011-2012 Study Setup 00Z Simulations (all other options identical) • Produced by APX • NCEP SST/Ice • Morrison Microphysics • Produced by NASA SPoRT • NASA SPoRT SST/Ice • Morrison Microphysics • Examine 12-36 Hour Forecasts (to match COOP obs time) 12Z Simulations (all other options identical) • Produced by APX • NCEP SST/Ice • Lin et al. Microphysics • Produced by NASA SPoRT • NCEP SST/Ice • Morrison Microphysics • Examine 00-24 Hour Forecasts (to match COOP obs time) SST Sensitivity Runs Microphysics Sensitivity Runs
APX Local WRF – Basic Setup • Two Nests • 12km Outer • 4km Inner • Run at 00/12Z • Length: 36 hour • IC/BCs: Previous GFS • CP Scheme • Outer: Kain-Fritsch • Inner: None • PBL: Yonsei • Operational Availability: T+3hr (~03/15Z)
SST Comparison – Lake Michigan Average Difference: +0.7oC
SST Comparison – Lake Superior Average Difference: +0.1oC
Ice Comparison –Average Lake Coverage Average Difference: -0.3%
MaxT Comparison – Gaylord, MISST Sensitivity – 00Z Simulations
MinT Comparison – Gaylord, MISST Sensitivity – 00Z Simulations
QPF Comparison – Gaylord, MISST Sensitivity – 00Z Simulations
QPF Comparison – Gaylord, MISST Sensitivity – 00Z Simulations Gaylord – Total Liquid Precip: 1.08” NASA SST – Total Liquid Precip: 1.58” NCEP SST – Total Liquid Precip: 1.53” NASA SST – 0.1” POD: 0.33 FAR: 0.67 CSI: 0.20 NCEP SST – 0.1” POD: 0.33 FAR: 0.75 CSI: 0.17 3 out of 26 days with 0.1” liquid observed
QPF Comparison – Gaylord, MIMicrophysics Sensitivity – 12Z Simulations
QPF Comparison – Gaylord, MIMicrophysics Sensitivity – 12Z Simulations Gaylord – Total Liquid Precip: 1.08” Lin et al. – Total Liquid Precip: 1.01” Morrison – Total Liquid Precip: 0.71” Lin et al. – 0.1” POD: 0.00 FAR: 1.00 CSI: 0.00 Morrison – 0.1” POD: 0.33 FAR: 0.50 CSI: 0.25 3 out of 26 days with 0.1” liquid observed
QPF Comparison – Sault Sainte Marie, MISST Sensitivity – 00Z Simulations
QPF Comparison – Sault Sainte Marie, MISST Sensitivity – 00Z Simulations SSM – Total Liquid Precip: 1.38” NASA SST – Total Liquid Precip: 1.68” NCEP SST – Total Liquid Precip: 1.63” NASA SST – 0.1” POD: 0.50 FAR: 0.40 CSI: 0.38 NCEP SST – 0.1” POD: 0.50 FAR: 0.40 CSI: 0.38 6 out of 26 days with 0.1” liquid observed
QPF Comparison – Sault Sainte Marie, MIMicrophysics Sensitivity – 12Z Simulations
QPF Comparison – Sault Sainte Marie, MIMicrophysics Sensitivity – 12Z Simulations SSM – Total Liquid Precip: 1.38” Lin et al. – Total Liquid Precip: 1.70” Morrison – Total Liquid Precip: 1.08” Lin et al. – 0.1” POD: 0.50 FAR: 0.40 CSI: 0.33 Morrison – 0.1” POD: 0.67 FAR: 0.33 CSI: 0.44 6 out of 26 days with 0.1” liquid observed
Side by Side Comparison – Example18 Jan 2012 Morrison Lin et al.
Summary • Temperature Climatology reasonably simulated • Max T forecasts more skillful than Min T • Strong warm bias under radiational cooling • Similar performance regardless of SST/Microphysics • SPoRT SST Trends Similar to 2010-2011 • SPoRT SST > NCEP • Inconclusive trends on Ice coverage
Summary - Continued • Morrison Microphysics Scheme provides improvement on high QPF bias seen with Lin et al. • Higher CSI for 0.1” events at Gaylord and Sault Sainte Marie • Result may be obscured some by “model spin up” • Differences in QPF > Differences in band position between different microphysics schemes • Suggests that switching microphysics scheme provides an overall improvement to “usability” of model data • Little difference in overall performance using differing SST/Ice initialization
Acknowledgements • Rob Rozumalski • WRF EMS Developer • NCDC • Radar Data Archive • NAM Archive • Weather and Climate Toolkit • GrADS • Plots