Download
1 / 20
200 likes | 393 Views
Update on LIS activities LIS in AWIPS II Training Development -and- Operational Utility at NWS Huntsville. Kristopher White – NWS Huntsville / NASA SPoRT Jonathan Case – NASA SPoRT / ENSCO. SPoRT LIS in AWIPS II Grib2 files, so ingest is relatively easy (instructions available)

E N D
Update on LIS activitiesLIS in AWIPS IITraining Development-and- Operational Utility at NWS Huntsville Kristopher White – NWS Huntsville / NASA SPoRT Jonathan Case – NASA SPoRT / ENSCO
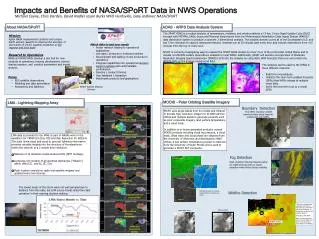
SPoRT LIS in AWIPS II • Grib2 files, so ingest is relatively easy (instructions available) • LIS Data Include: • AVSFT: Average Surface Skin Temperature (C) • TSOIL: Soil Temperature • 0.0-0.1: 0-1 cm depth • 0.1-0.4: 1-4 cm depth • 0.4-1.0: 4 cm to 1 m depth • 1.0-2.0: 1-2 m depth • MSTAV: Moisture Availability (Relative Soil Moisture, %) • 0.0: 0-200 cm depth • 0.0-0.1: 0-1 cm depth • 0.1-0.4: 1-4 cm depth • 0.4-1.0: 4 cm to 1 m depth • 1.0-2.0: 1-2 m depth • SOILW: Volumetric Soil Moisture Content (%) • 0.0-0.1: 0-1 cm depth • 0.1-0.4: 1-4 cm depth • 0.4-1.0: 4 cm to 1 m depth • 1.0-2.0: 1-2 m depth • Precipitation: LIS Surface Precipitation (GFS precipitation, inches) • LHF: Latent Heat Flux (W/m2) • SHF: Sensible Heat Flux (W/m2) • SSRUN: Surface Storm Runoff (mm) • GVF: Green Vegetation Fraction (%) SPoRT LIS “Skin” Temperature SPoRT LIS 0-10 cm Relative Soil Moisture
SPoRT LIS in AWIPS II • Advantages • Can now display sub-surface values • Easier editing of menus for the Volume Browser • Can overlay multiple data/image files • Radar imagery and/or precipitation forecasts over soil moisture values can provide improved confidence and better forecasts of flood potential (more on this later) • Radar imagery over skin temperatures can provide a better assessment of the potential for freezing precipitation accumulation SPoRT LIS 0-10 cm Relative Soil Moisture SPoRT LIS “Skin” Temperature
SPoRT LIS in AWIPS II • Instructions available for… • ingest into AWIPS II • configuring Volume Browser • VbSources.xml • planesMenuPlanView.xml • LevelMappingFile.xml • gridImageryStyleRules.xml • fieldsMenus.xml • d2dContourStyleRules.x • New colormaps also included • I have created these, but I’m open tosuggestions… SPoRT LIS 0-10 cm Relative Soil Moisture Any takers to try out the new instructions and colormaps?? SPoRT LIS “Skin” Temperature
SPoRT LIS Training • Under development…but coming soon! • Planned for release by spring • Currently ~40 slides • Overview of LIS • Configuration • Domain/resolution • Output • Example utility at NWS Huntsville, AL • Drought monitoring • Flood forecasting • Winter weather applications Sample Training Slides
SPoRT LIS • Operational Examples • -Drought Monitoring • SPoRT LIS soil moisture data have been used for input to the U.S. Drought Monitor since 2011 • These data help to answer the relevant question…how are soils responding to inputs of precipitation? • 3km resolution allow for assessments of soil moisture on sub-county scales • Weekly difference plots also available (online only) • In-situ networks such as SCAN can be useful, but consist of sparse point observations • In most cases, states with intensive agriculture have few sites • Conventional data of soil moisture percentages and anomalies can be very useful, but the imagery is of coarse spatial resolution SPoRT LIS 0-200 cm Relative Soil Moisture Weekly Difference SPoRT LIS 0-10 cm Relative Soil Moisture
SPoRT LIS Operational Examples -Drought Monitoring • Forecasters may have reasonable estimations of rainfall amounts, but determining how soils are responding to these inputs can be difficult to gauge. • Likewise, different soils respond in different ways, complicating the issue • The SPoRT LIS helps to resolve these issues
SPoRT LIS • Operational Examples • -Drought Monitoring • Case Example – late January 2014 • Alabama free of any drought designations as of the January 21st USDM update • However, lack of precipitation and very dry air with low RH/dew points (<0-20F) persisted for much of January, leading to rapid drying and desiccation of vegetation especially during the 4th week • Initial response was to draw D0 lines cutting across NW Alabama as shown • However, a close look at SPoRT LIS soil moisture data revealed the sub-surface conditions were likely just as dry or drier in some areas to the SE of this initial line • What happened?...input about these soil conditions indicated a need to draw the D0 line through the areas with dry soil conditions • Small county changes/additions can be significant when taking drought declarations into account New D0 New D0 SPoRT LIS 0-10 cm Relative Soil Moisture SPoRT LIS 0-200 cm Relative Soil Moisture
0-200 cm Relative Soil Moisture – 3/4/2011 SPoRT LIS Operational Examples-Monitoring Flood Potential 0-200 cm Relative Soil Moisture – 9/4/2011 • Contrasting antecedent soil moisture conditions (as shown above) • Relatively heavy rainfall in each event, but greater rainfall in the September case • Very different outcomes
SPoRT LIS Operational Examples-Monitoring Flood Potential Early March 2011 Case… 0-200 cm Relative Soil Moisture – 3/4/2011 Antecedent deep-layer soil moisture values were around 45-55% before heavy rains moved into the area over the next week.
Stage IV 2-Day Precipitation ending 1200 UTC 3/6/2011 SPoRT LIS Operational Examples-Monitoring Flood Potential Early March 2011 Case… 0-200 cm Relative Soil Moisture 0900 UTC 3/7/2011 • Precipitation totaled ~1-3 inches across northern Alabama and adjacent areas • In response to the rainfall, deep layer relative soil moisture values rose about 10 percent
Stage IV 1-Day Precipitation ending 1200 UTC 3/9/2011 SPoRT LIS Operational Examples-Monitoring Flood Potential Early March 2011 Case… 0-200 cm Relative Soil Moisture 0900 UTC 3/9/2011 • Precipitation totaled ~1-4 inches across northern Alabama and adjacent areas • In response to the rainfall, deep layer relative soil moisture values rose another 10 percent
SPoRT LIS Operational Examples-Monitoring Flood Potential Early March 2011 Case… 0-200 cm Relative Soil Moisture 0900 UTC 3/9/2011 (stars indicate locations of flooding) • During and after the 2nd round of heavy rainfall, flooding occurred in numerous locations, with many road closures. • 23 Flood warning products resulted across the Huntsville County Warning Forecast Area. • Moderate flooding occurred along the Tennessee, the Big Nance and the Flint Rivers
SPoRT LIS Operational Examples-Monitoring Flood Potential Early September 2011 Case… 0-200 cm Relative Soil Moisture 0900 UTC 9/4/2011 Antecedent relative soil moisture values were around 25-40% before heavy rains in association with the remnants of Tropical Storm Lee moved into the area over the next week.
Stage IV 2-Day Precipitation ending 1200 UTC 9/6/2011 SPoRT LIS Operational Examples-Monitoring Flood Potential Early September 2011 Case… 0-200 cm Relative Soil Moisture 0900 UTC 9/7/2011 • Precipitation totaled ~4-10 inches across northern Alabama and adjacent areas • In response to the rainfall, deep layer relative soil moisture only increased about 15%
SPoRT LIS Operational Examples-Monitoring Flood Potential Early September 2011 Case… Stage IV 2-Day Precipitation ending 1200 UTC 9/6/2011 • Flood warnings issued for several rivers, including the Big Nance, Flint, Paint Rock and Tennessee River • None of the flood warnings verified • Moderate flooding forecast for the Flint River was overestimated by 10 feet!
SPoRT LIS Operational Examples-Monitoring Flood Potential Early September 2011 Case… Stage IV 2-Day Precipitation ending 1200 UTC 9/6/2011 0-200 cm Relative Soil Moisture 0900 UTC 9/7/2011 • Minor flooding did occur along the Big Wills Creek in Ft Payne, where rainfall amounts were around 10 inches. • Other minor, short-lived flooding occurred in parts of north central and northeastern Alabama
SPoRT LIS Operational Examples-Monitoring Flood Potential March Event September Event High antecedent soil moisture Moderate-heavy precipitation Moderate river flooding and numerous flooding reports Low antecedent soil moisture Heavy precipitation Isolated minor flooding • Very contrasting antecedent soil moisture conditions likely played a strong role in the different outcomes • Local, subjective analysis of several events suggests typical moderate-heavy synoptic rainfall events (>2-3 inches) over deep-layer relative soil moisture values exceeding 55-60% will lead to at least minor flooding events along secondary streams/rivers
SPoRT LIS • Operational Examples • -Winter Applications • Relatively recent usage • Radar can be used to overlay Skin Temperatures to help assess likelihood for freezing precipitation accumulation (left above) • Skin Temperature progs can be used to assess freezing potential. In the graphic to the right, I’ve loaded NAM 6-hour simulated 0.5 reflectivity over the LIS 6-hour Skin Temperature forecast SPoRT LIS Skin Temperature w/ Regional Composite 0.5 Reflectivity SPoRT LIS Skin Temperature w/ WPC 6-Hour Precipitation
That’s all from me! If you have any questions, please feel free to contact me: kris.white@noaa.gov 256-890-8503 ext 232